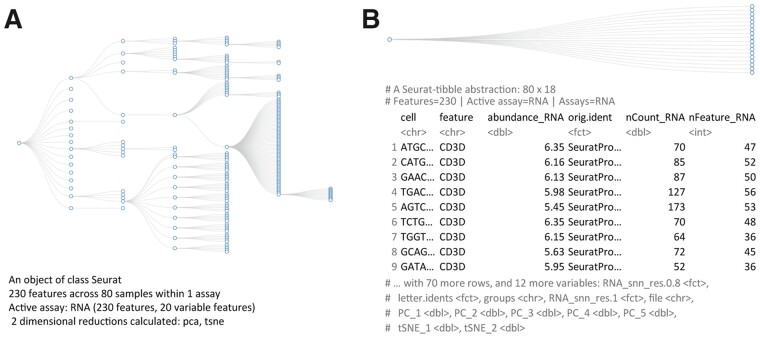
Fig. 1.
Comparison between the data structure (https://github.com/boxuancui/DataExplorer) (top; abstracted tibble for tidyseurat) and the information presented to the user (bottom) for Seurat (A) and tidyseurat (B; including transcript information). The dataset underlying these visualizations is a subset of a peripheral blood mononuclear cell fraction provided by 10× (10xgenomics.com)

