Fig. 4.
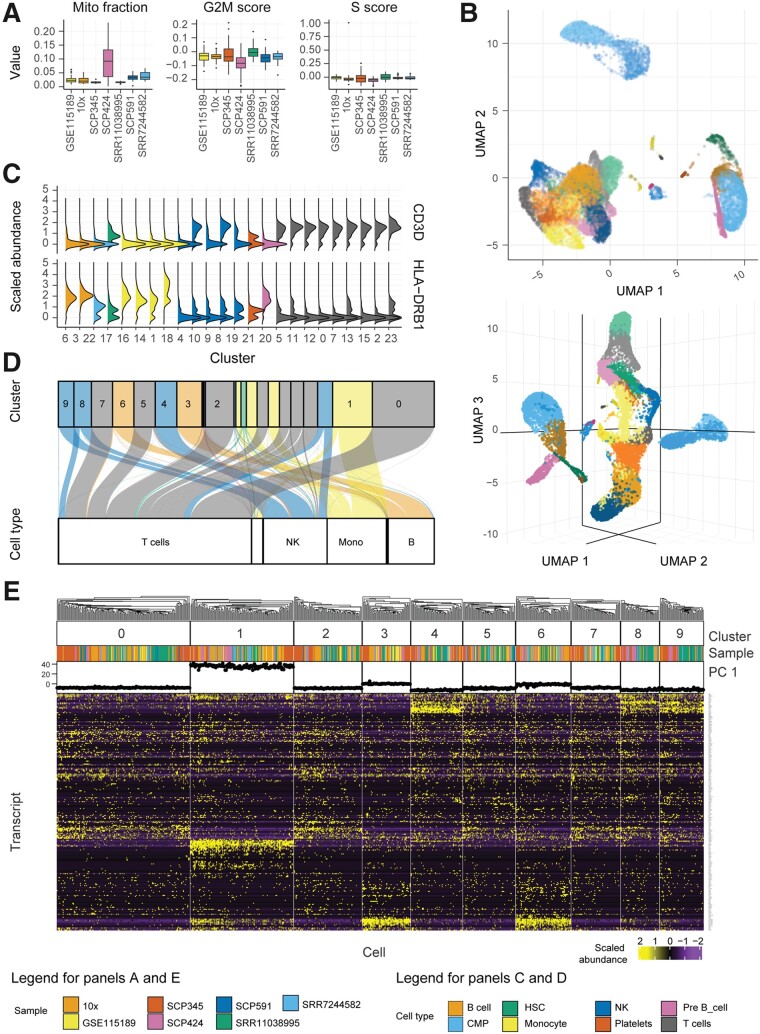
Tidyverse-compatible libraries offer powerful, flexible and extensible tools to visualize single-cell RNA sequencing data. Natively interfacing with such tools expands the possibilities for the user to learn from the data. Graphical results of the example workflow, integrating Seurat and tidyverse with tidyseurat. (A) Sample-wise distribution of biological indicators, including the proportion of mitochondrial transcripts and cell-cycle phase scores. For optimum visualization, a 20% subsampling was performed on the cell set. (B) Cells mapped in two- and three-dimensional UMAP space. The default integration of reduced dimensions and other cell-wise information in a tibble abstraction facilitates such visualization. (C) Distribution of transcript abundance for two marker genes, identified for each cluster identified by unsupervised estimation. Cells mapped in two-dimensional Uniform Manifold Approximation and Projection (UMAP) space. (D) Mapping of cells between the cell- or cluster-wise methods for cell-type classification. Only large clusters are labelled here. The colour scheme refers to cell types classified according to clusters. The bottom containers refer to the classification based on single cells. (E) Heatmap of the marker genes for cell clusters, produced with tidyHeatmap, annotated with data source and the first principal component. Only the ten largest clusters are displayed. The integrated visualization of transcript abundance, cell annotation and reduced dimensions is facilitated by the ‘join_features’ functionality and by the default complete integration of cell-wise information (including reduced dimensions) in the tibble abstraction

