Fig. 5.

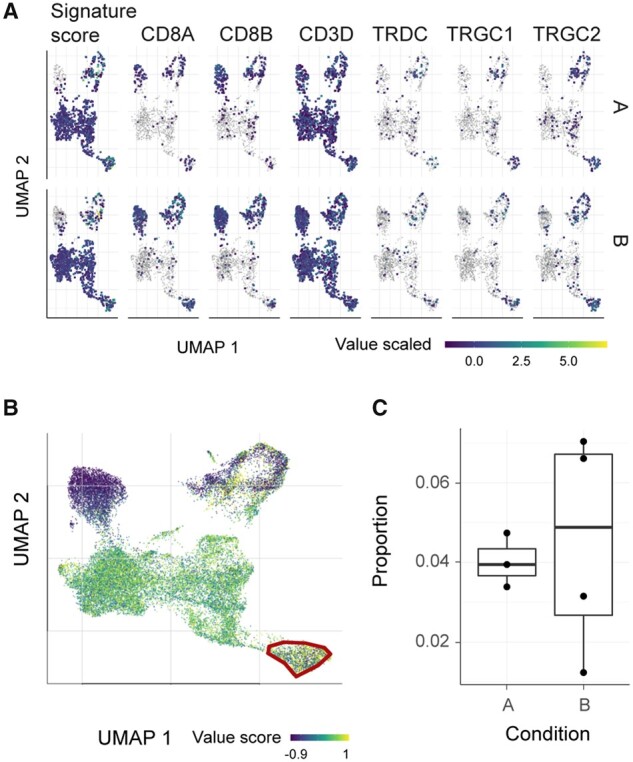
Presence of gamma delta T cells among lymphocytes, part of the case study for comparing Seurat with tidyseurat. (A) Integrative UMAP plot including both the signature score and the genes within the signature. Plots are faceted horizontally for biological condition (artifactual). (B) Interactive gating of high scoring cells for the gamma delta T cell signature (Pizzolato et al., 2019), using tidygate (github.com/stemangiola/tidygate). (C) Distribution of the proportion of gamma delta T cells across patients from conditions A and B
