Fig. 2.

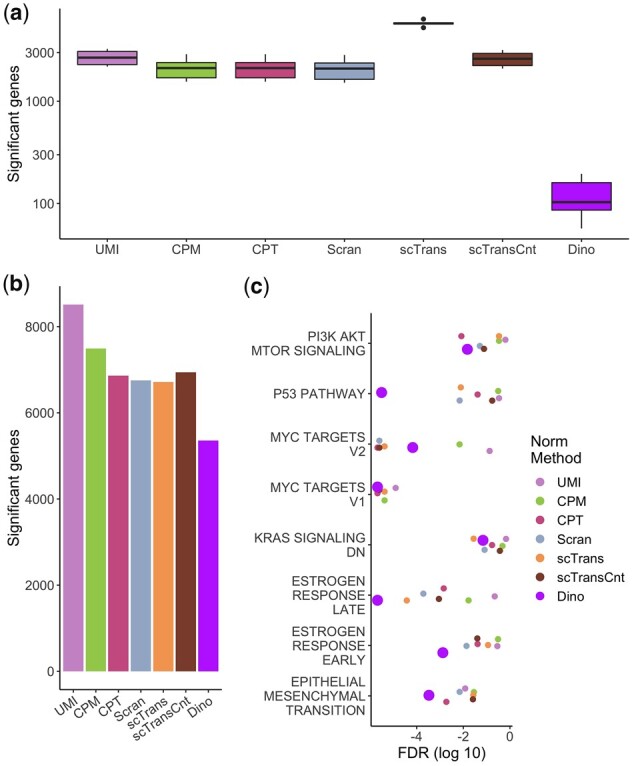
The effects of normalization on downstream DE and enrichment analysis. (a) Expression data from the PBMC68K_Pure dataset were normalized and genes were tested for DE using a Wilcoxon rank-sum test between low-LS and high-LS cells (5–25% and 75–95% of LS respectively) within cell-type annotations. Box plots show numbers of significant genes. Given that cells only differ in LS, significant results are considered false positives. (b) Expression data from the EMT dataset were analyzed using Monocle2 to identify genes with significantly variable expression over pseudo-time. Total numbers of significant genes are shown in a bar plot. (c) Significance values of Hallmark terms enriched for DE genes from the EMT dataset, colored for each normalization method, are plotted for the subset of terms previously identified as defining expression shifts during epithelial to mesenchymal transition.
