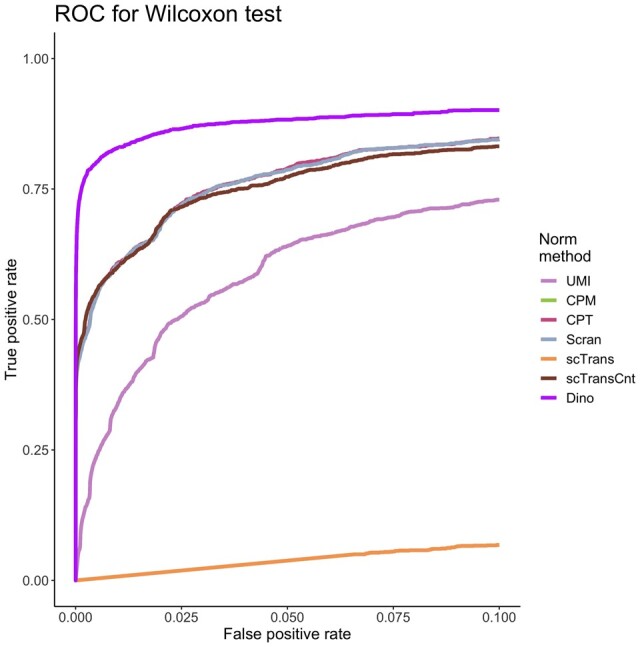
Fig. 3.

The effects of normalization on downstream DE analysis. Simulated data based on the PBMC68K_Pure dataset were normalized using each method. ROC curves colored by normalization method define the relationship between average TPR and average FPR for a Wilcoxon rank-sum test, where the average is calculated across 30 simulated datasets.
