
Fig. 1.
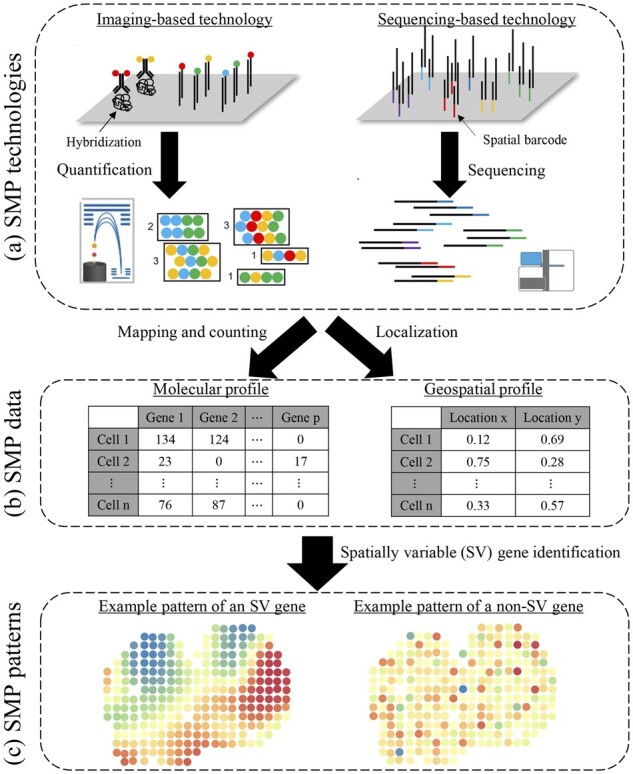
Flowchart of an SMP study. (a) Hybridization and quantification phases in imaging-based SMP technologies (left) and barcoding and sequencing phases in sequencing-based SMP technologies (right). (b) An example of molecular profile Y (left) and an example of geospatial profile T (right). (c) Examples of molecular spatial distributions to an SV gene and a non-SV gene