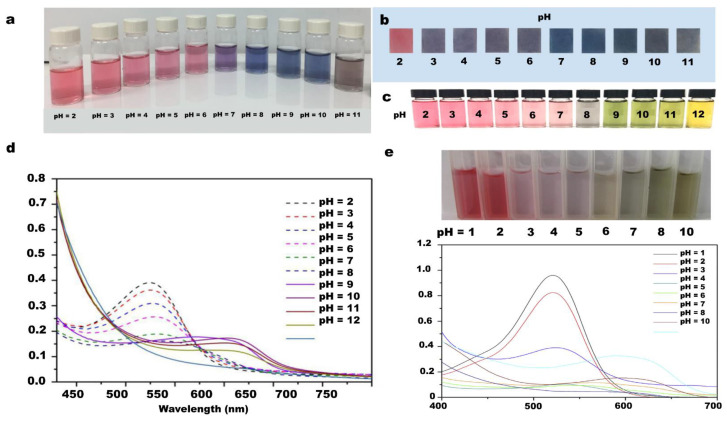
Figure 10.
Color reaction of anthocyanins solution from black carrot at different pH conditions (pH 2–11). (a) color reaction of the solvent; (b) color reaction of indicator after immersion in solution; (c) color change of grape skin extraction solution at different pH conditions; (d) UV–Vis spectrum of grape skin extraction solution at different pH conditions; (e) image and UV-Vis spectrum of anthocyanin solutions in different pH conditions.

