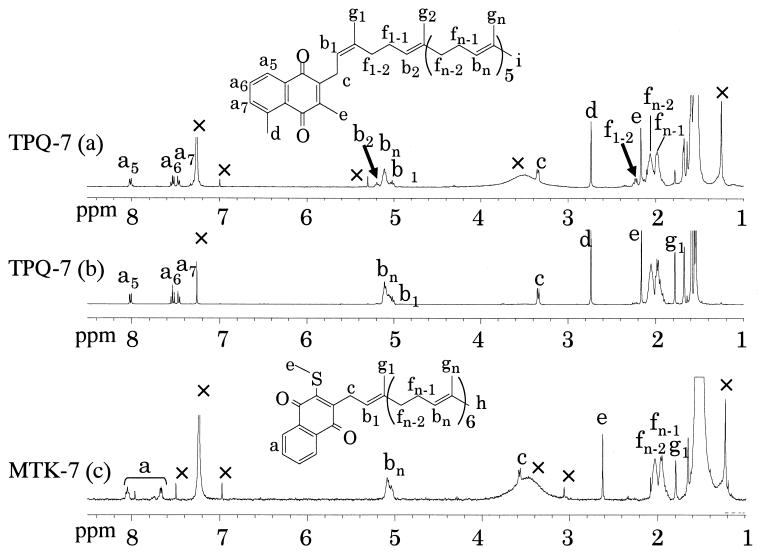
FIG. 3.
1H NMR spectra (400 MHz). Shown are results of TPQ-7(a) in CDCl3, 128 scans; TPQ-7(b) in CDCl3, 16 scans; and MTK-7 (c) in CDCl3, 128 scans. All spectra were recorded at an ambient temperature. Signals of impurity, water, or solvent are denoted by a ×. In the TPQ-7(a) spectrum, signals different from those of TPQ-7(b) are denoted by arrows.

