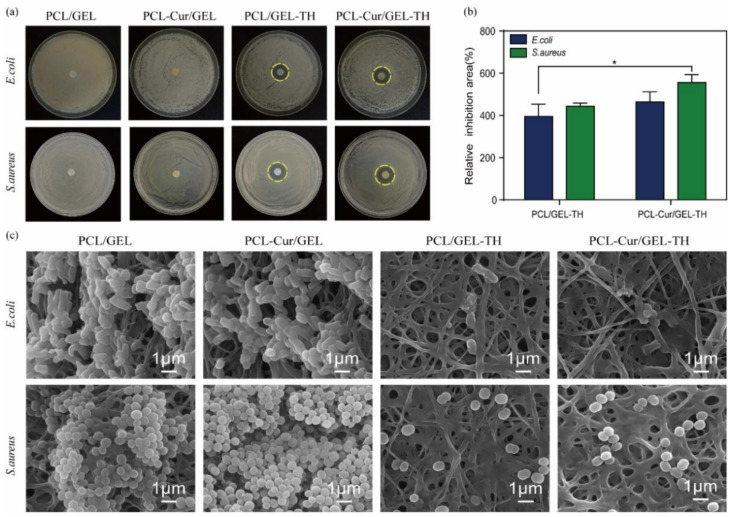
Figure 4.
Antibacterial activity of different samples against E. coli and S. aureus. (a) Inhibition zone analysis. The yellow dotted circle in the figure is the inhibition zone. (b) Inhibition area of different samples (n = 3). (c) SEM images of E. coli and S. aureus on different membranes. * p < 0.05.

