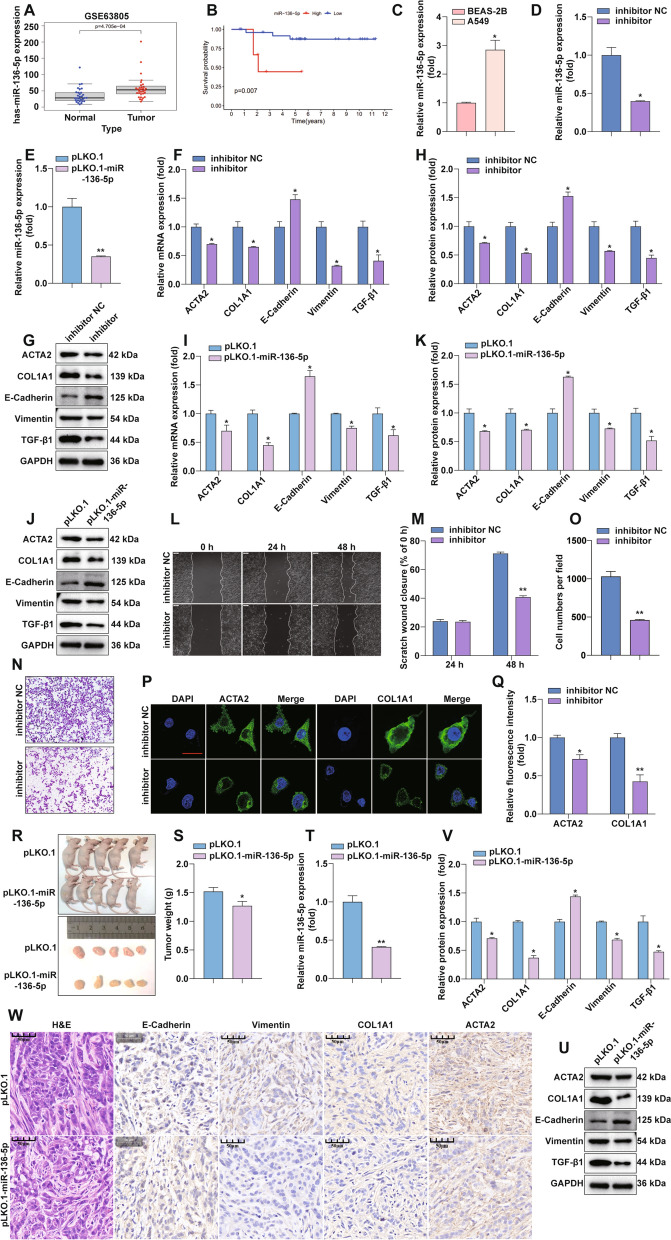
Fig. 3.
MiR-136-5p promotes EMT and fibrosis in LUAD. A GEO database analysis-miR-136-5p expression differences in LUAD and normal lung tissues. B Analysis of miR-136-5p expression in relation to survival of LUAD using GEO database. C RT-qPCR detection of miR-136-5p expression differences in BEAS-2B and A549. D MiR-136-5p inhibitor treatment A549 after RT-qPCR to detect the mRNA expression of miR-136-5p. E Stable knockdown of miR-136-5p and RT-qPCR to detect the knockdown efficiency of miR-136-5p. F MiR-136-5p inhibitor treatment of A549 after RT-qPCR to detect the expression of EMT and fibrosis markers. G, H MiR-136- 5p inhibitor treatment of A549, WB to detect the protein expression of TGF-β1, E-Cadherin, Vimentin, ACTA2 and COL1A1. Statistical quantification by ImageJ software. I Stable knockdown of miR-136-5p followed by RT-qPCR to detect the expression of EMT and fibrosis markers. J, K After stably knocking out miR-136-5p, the expression of related proteins was detected by WB and statistically quantified by ImageJ software. L, M Wound scratch assay was performed to monitor cell migration after MiR-136-5p inhibitor treatment of A549 cells, Statistical data are shown. N, O Invasion assay was performed to determine cell invasion after miR-136-5p inhibition treatment of A549 cells. P, Q MiR-136-5p inhibitor A549 was followed by an Immunofluorescence assay performed to detect the expression of the fibrosis-associated protein. Statistical data are shown. R Subcutaneous tumorigenic demonstration in nude mice. S Tumor weights were represented as the means of tumor weights ± SD. T RT-qPCR to confirm the effect of miR-136-5p knockdown in tumor tissues. U, V WB to detect the expression of miR-136-5p stable knockdown of TGF-β1, E-Cadherin, Vimentin, ACTA2 and COL1A1 in tumor tissues. Statistical data are shown. W The tumor sections underwent IHC staining and H&E staining

