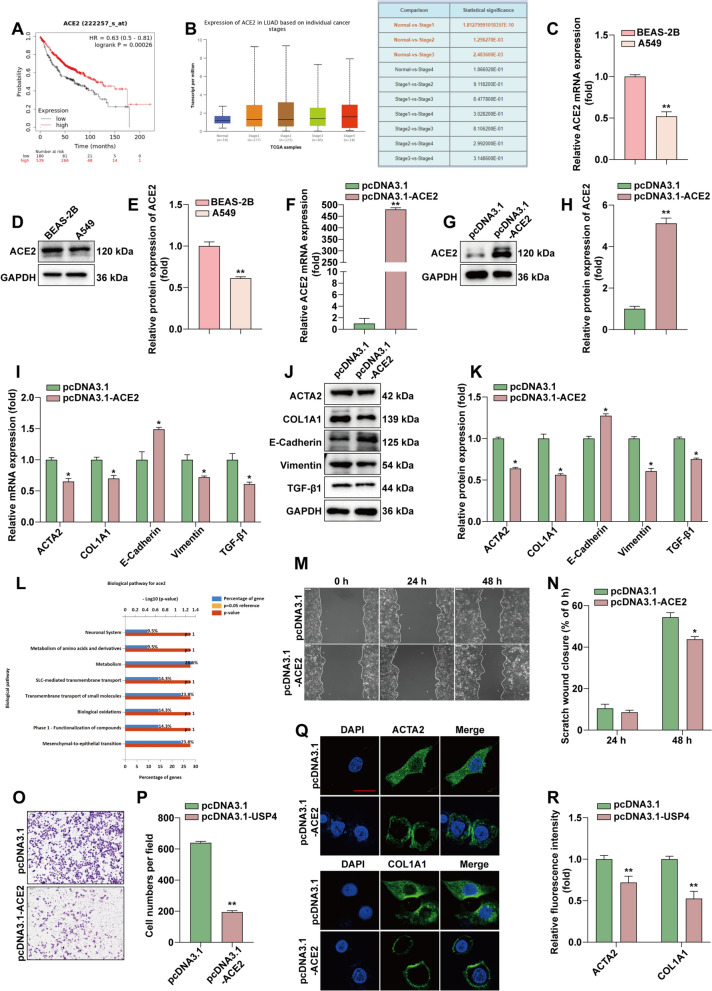
Fig. 6.
Overexpression of ACE2 is involved in EMT and fibrosis in LUAD. A Kaplan–Meier plotter analysis of ACE2 expression in relation to survival in lung cancer patients. B Higher ACE2 levels were positively correlated with cancer stage. C RT-qPCR detection of ACE2 in BEAS-2B and A549. D, E WB detection of ACE2 protein expression in BEAS-2B and A549, and statistical quantification of ACE2 protein expression by ImageJ software. F After overexpression of ACE2, RT-qPCR detection of ACE2 mRNA expression levels. G, H After overexpression of ACE2, WB to detect ACE2 protein expression levels after overexpression of ACE2. ImageJ software for statistical quantification. I RT-qPCR to detect EMT and fibrosis marker expression after overexpression of ACE2. J, K WB to detect the protein expressions of TGF-β1, E-cadherin, vimentin, ACTA2 and COL1A1 after overexpression of ACE2. ImageJ software for statistical quantification of protein expression. L Functional enrichment of ACE2 analysis. M, N Cell migration was monitored by wound scratch assay after overexpression of ACE2. O, P Cell invasion was measured by invasion assay after overexpression of ACE2 and counted statistically by ImageJ. Q, R Immunofluorescence assay to detect fibrosis-associated protein expression after overexpression of ACE2. Statistical data are shown

