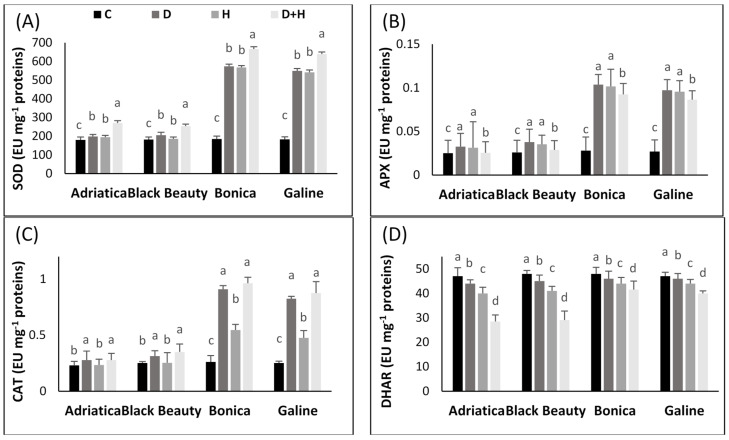
Figure 4.
Changes in SOD (A), APX (B), CAT (C), and DHAR (D) of four eggplant cultivars under individual and combined stresses. Data presented are the means ± SE (n = 5). Significant dissimilarities are shown by different lower-case letters between treatments p ≤ 0.05 based on Tukey’s test. (C, control; H, heat stress; D, drought stress; H + D, heat + drought stresses).

