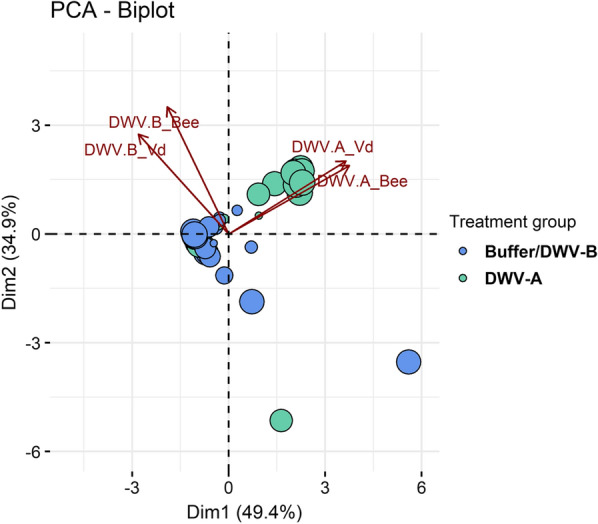
Fig. 3.

Principal component analysis biplot of DWV variant quantifications in mites (Vd) and in bees. The bees and mites from the three different treatments (inoculation with DWV-A, with DWV-B or with PB solution) were analyzed at two time points: right after the inoculation period and at the end of the in vitro rearing period (see Fig. 1). The pre-existing DWV-B infection of pupae resulted in high DWV-B copy number in all three groups so the DWV-B-inoculated and buffer-injected groups were pooled together on this graph since they had the same viral profiles
