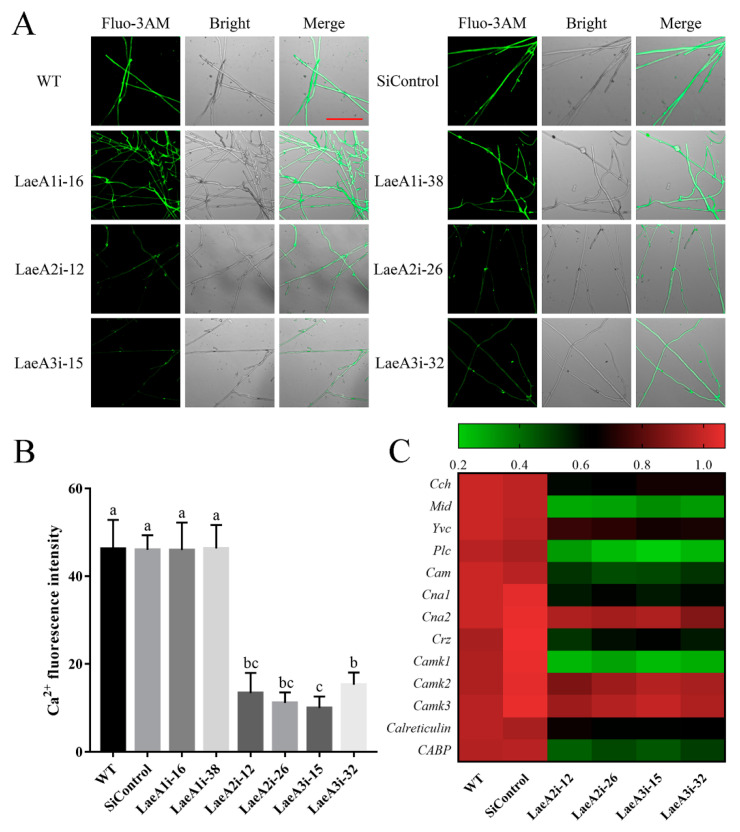
Figure 6.
The cytosolic Ca2+ content in the PoLaeA-silenced strains. The fungal strains were cultured on CYM plates at 28 °C for 4 days. (A) Fluo-3AM staining (scale bar = 100 μm). For detection, 50 μM Fluo-3AM, a Ca2+ fluorescent probe, was used to monitor the fluorescence intensity using an LSM780 confocal laser scanning microscope. Green fluorescence represents the free cytosolic Ca2+. (B) Ca2+ fluorescence values. The fluorescence was analyzed with ZEN 3.3 (blue edition). (C) Transcriptional analysis of Ca2+-related genes. The expression levels of the Ca2+-related genes in the WT strain were arbitrarily set to 1.0. The values are the mean ± SD (n = 3). Different lowercase letters indicate significant differences between the strains (p < 0.05, according to Dunnett’s multiple comparisons test).

