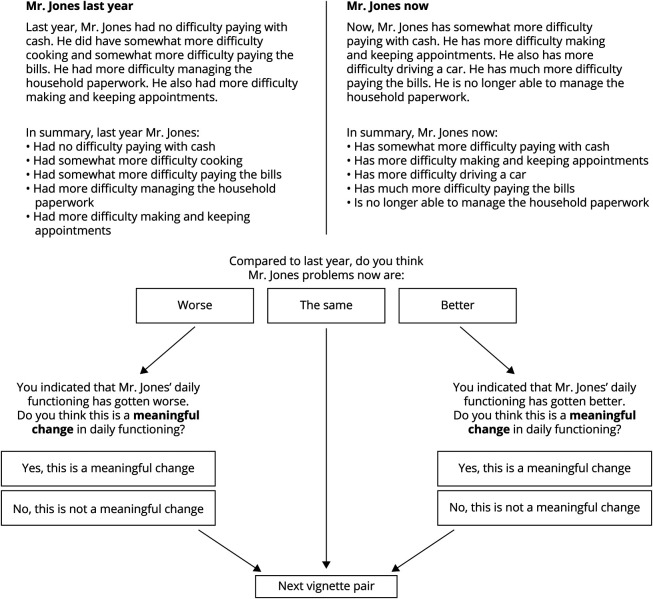
Figure 1. Example Question From the MIC Survey.
First, 2 vignettes are shown side-by-side, with one representing functioning of a fictional patient 1 year ago (the “reference vignette” on the top left, anchored in the example at T = 46) and the other representing functioning now (the “comparison vignette” on the top right, anchored in the example at T = 42). The respondent is asked to indicate whether they think the problems have worsened, remained the same, or improved from 1 year ago to now. Depending on the answer, they will be asked a follow-up question to determine whether the change (if any) was meaningful.

