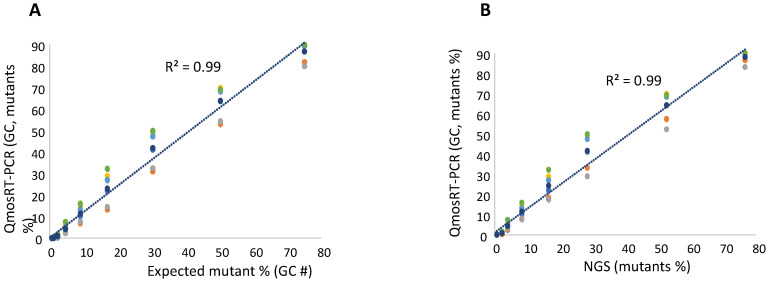
Figure 3.
Results of the qmosRT-PCR assay using plasmid reference standards for quantification of nOPV2-c1_171 mutants, generated from the virus-spiked samples: (A) the mutant percentages generated by qmosRT-PCR are plotted against the expected percentages of mutants and (B) the mutant percentages generated by qmosRT-PCR are plotted against the results of Illumina sequencing (NGS). The correlation line is drawn for the averages of the qmosRT-PCR results. The results of different qmosRT-PCR run (Table 3) are presented with different colors.

