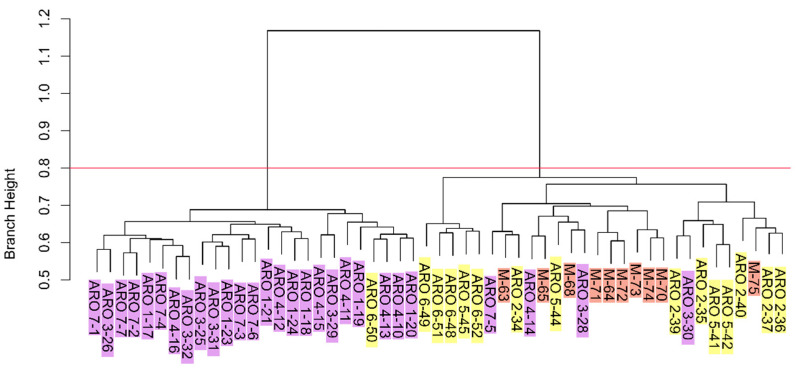
Figure 4.
Hierarchical clustering. Labels at the leaves of the dendrogram indicate the population ID (ARO1-7 and M) and the individual ID number. Purple, yellow, and orange label highlighting indicate sampling of individuals within the ARO_K1, ARO_K2 and M populations, respectively. The red line cuts the dendrogram for two major genetic clusters.

