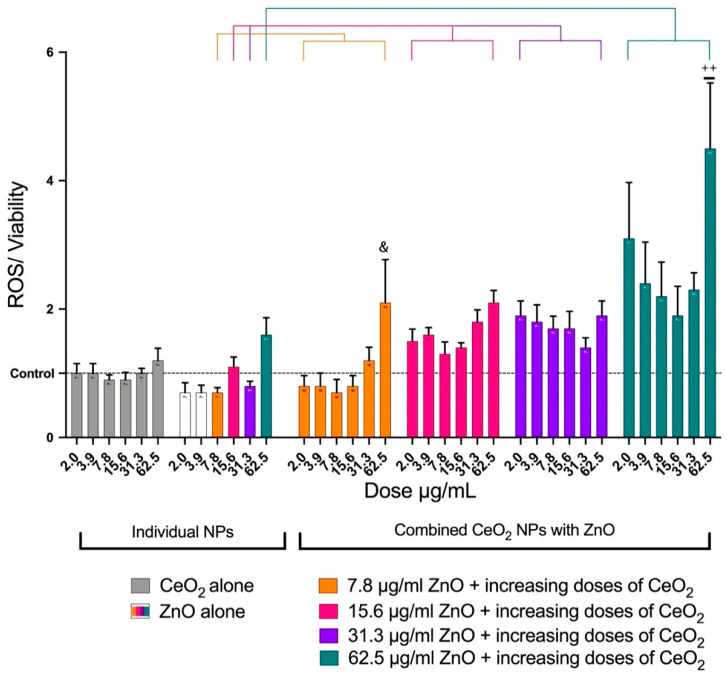
Figure 5.
Generation of ROS after treating A549 cells with NPs for 24 h. The plot shows the mean ± SEM of ROS generation (n = 7) in A549 cells treated with ZnO, CeO2, or a mixture of both. ROS was normalized for cell viability, ROS (% of control)/viability (% of control). The CeO2 group (gray) had no effect on ROS. Increasing doses of ZnO only caused an increase in ROS generation. The mixture of both NPs caused more toxicity than ZnO alone. The presence of CeO2 augmented ZnO toxicity. (&) Significantly different (p < 0.05) from 7.8 μg/mL of ZnO alone. (++) Significantly different (p < 0.01) from 62.5 μg/mL of ZnO alone.

