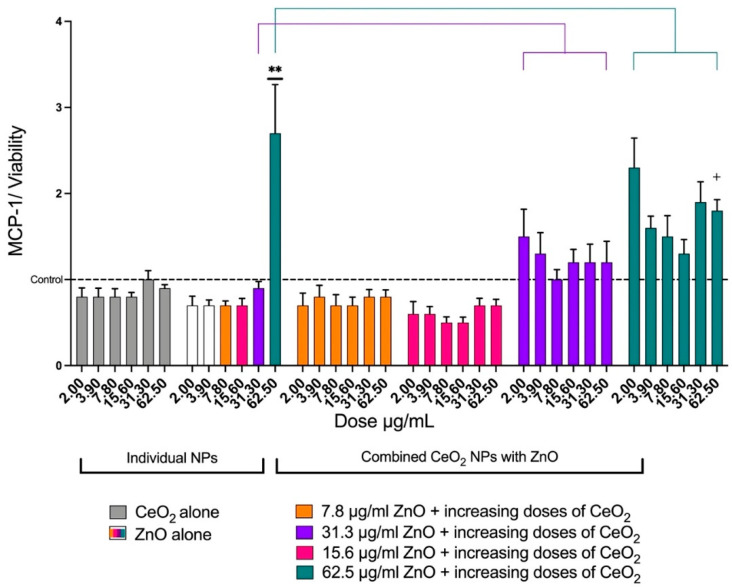
Figure 7.
The effects of ZnO and CeO2 NPs in individual and mixture forms on the release of MCP-1 from A549 cells. The graph presents the mean ± SEM of MCP-1 release from six treatments of A549 cells with ZnO, CeO2, or mixtures of both. Levels of MCP-1 were normalized for cell viability, MCP-1 (% of control)/viability (% of control). CeO2 did not cause an elevation in MCP-1 release (gray). Increasing the doses of ZnO affected MCP-1 release only at 62.5 μg/mL. The mixture of 62.5 μg/mL of ZnO and 62.5 μg/mL of CeO2 caused a significant reduction in MCP-1 (teal). (**) Significantly different (p < 0.01) from the control. (+) Significantly different (p < 0.05) from 62.5 μg/mL of ZnO alone.

