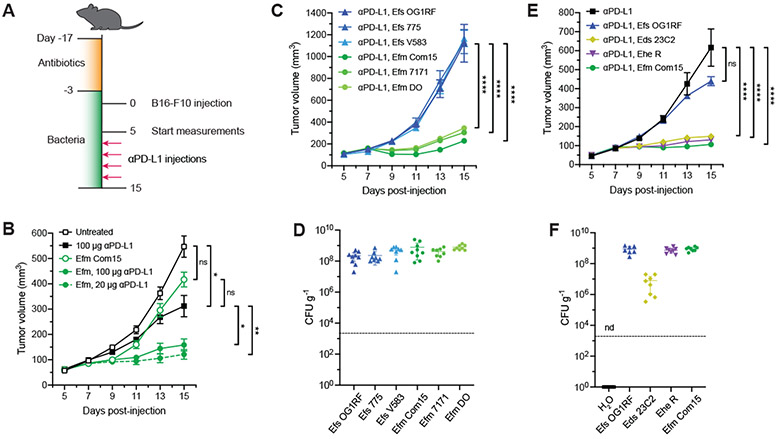
Fig. 1. Specific enterococci improve efficacy of anti–PD-L1 immunotherapy in B16-F10 melanoma model.
(A) Schematic of tumor growth model in SPF mice with antibiotic treatment and oral enterococci supplementation. Days are indexed based on the day of tumor injection. Mice were provided antibiotic-containing water ab libitum for two weeks followed by water supplemented with the indicated enterococci for the remainder of the experiment. Animals were then subcutaneously implanted with B16-F10 melanoma cells, and tumor volume measurements started when tumors reached ~50-100 mm3 (day 5). Mice were treated with anti–PD-L1 by intraperitoneal injection every other day starting two days after the start of the tumor measurement. For all data except for (B), 20 μg anti–PD-L1 was used for each injection. (B) B16-F10 tumor growth in antibiotic-treated animals that were supplemented with or without E. faecium (Efm) Com15 and treated with or without anti–PD-L1 starting on day 7 at doses indicated in the legend. n = 7-8 mice per group. (C) B16-F10 tumor growth in antibiotic-treated mice that were supplemented with the indicated E. faecalis (Efs) and E. faecium (Efm) strains and treated with anti–PD-L1 starting on day 7. n = 7-8 mice per group. (D) Colony forming unit (CFU) analysis of E. faecalis (Efs) and E. faecium (Efm) strains in fecal samples harvested from animals as treated in (C). (E) B16-F10 tumor growth in antibiotic-treated mice that were supplemented with the indicated enterococci strains and treated with anti–PD-L1 starting in day 7. n = 8-9 mice per group. (F) CFU analysis of enterococci in fecal samples harvested from animals as treated in (E). nd = not detected. For (B), (C), and (E), data represent mean ± s.e.m. and were analyzed by mixed-effects model with Tukey’s multiple comparisons post-hoc test. *P < 0.05, **P < 0.01, ****P < 0.0001, ns = not significant. For (D) and (F), each symbol represents one mouse. Dotted lines indicate the limit of detection (2,000 CFU g−1). Data represent means ± 95% confidence interval.

