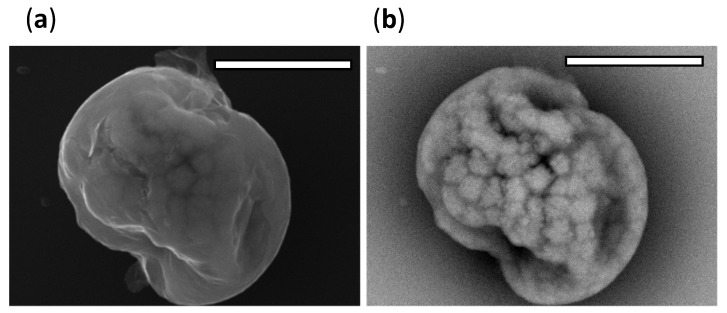
Figure 7.
SEM micrographs of a representative particle (DMEM, 10% FBS, 0.5% w/v mucin) collected from the bottom of the falling droplet column, magnification ×10,000, scale bar 5 µm. (a) SED images show topographic information of the particle. (b) BED-C images show the presence of inclusions within the dried particle.

