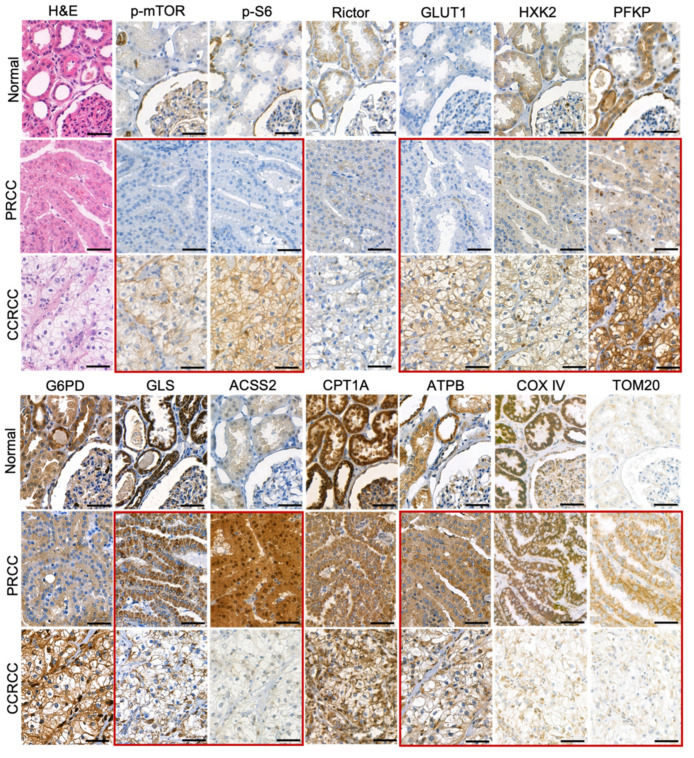
Figure 1.
Immunohistochemical analysis of mTOR and metabolic pathway markers in papillary (PRCC) and clear cell renal cell carcinomas (CCRCC). The expression of p-mTOR (marker for mTOR kinase activity), p-S6 (mTORC1 activity marker), Rictor (marker of the amount of mTORC2), GLUT1, HXK2, PFKP (glycolysis markers), G6PD (pentose phosphate pathway marker), GLS (glutaminolysis marker), ACSS2 (marker for acetate consumption), CPT1A (fatty acid β-oxidation marker), ATPB (OXPHOS marker), COX IV, and TOM20 (mitochondrial markers) was analyzed in normal kidney, PRCCs, and CCRCCs. The detected characteristic differences in enzyme expression profiles between PRCCs and CCRCCs were highlighted by red frame. Immunohistochemistry (DAB chromogen–brown) and hematoxylin counterstaining were used. Scale bars indicate 50 μm.

