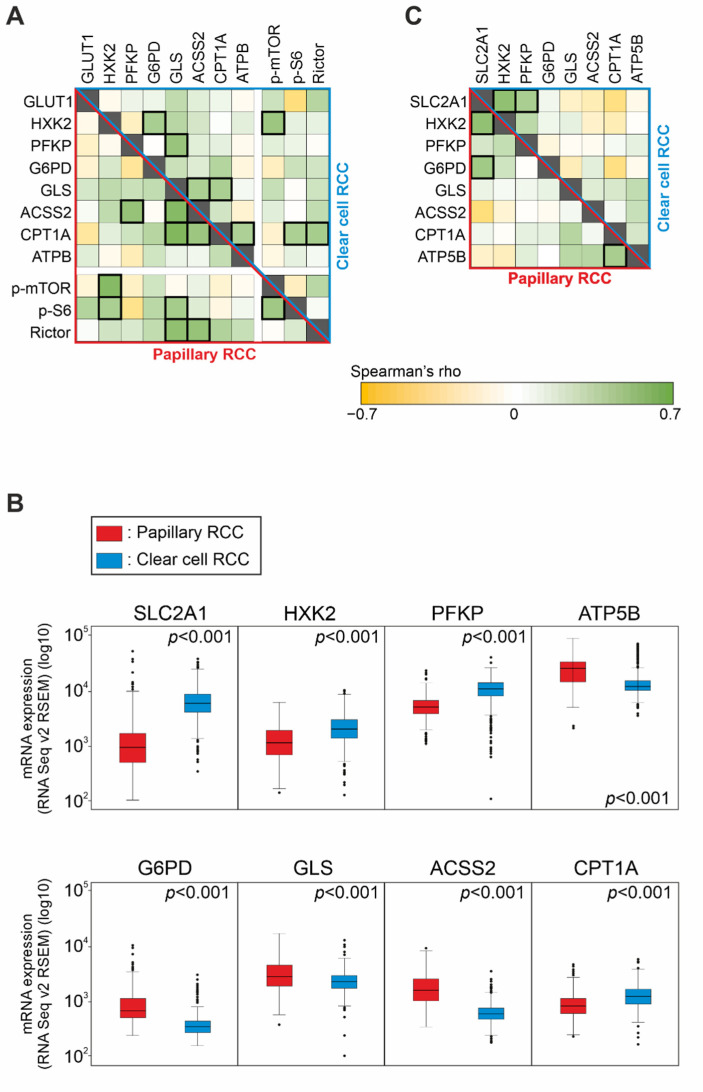
Figure 3.
Expression and correlation of the mTOR and metabolic pathway markers in papillary (PRCC) and clear cell renal cell carcinomas (CCRCC). (A) Correlation between the protein expression of GLUT1, HXK2, PFKP (glycolysis markers), G6PD (pentose phosphate pathway marker), GLS (glutaminolysis marker), ACSS2 (marker for acetate consumption), CPT1A (fatty acid β-oxidation marker), ATPB (OXPHOS marker), p-mTOR, p-S6, and Rictor (mTOR markers) in papillary (lower, red triangle) and in clear cell (upper, blue triangle) RCCs based on our IHC analysis. Green color indicates a negative, yellow color labels a positive correlation. Strong correlations (Spearman’s R > 0.4 and p < 0.05) are marked with a thick outline. (B) The mRNA expression of metabolic pathway markers in papillary and clear cell RCCs according to the TCGA KIRP (PRCC) and KIRC (CCRCC) datasets. SLC2A1 and ATP5B are mRNAs coding for GLUT1 and ATPB, respectively. Two-sided p values were considered statistically significant below 0.05 (Mann–Whitney U test). (C) Correlation between the mRNA expression of metabolic pathway markers in papillary (lower, red triangle) and clear cell (upper, blue triangle) RCCs according to the TCGA datasets. Green color indicates a negative, yellow color labels a positive correlation. Strong correlations (Spearman’s R > 0.4 and p < 0.05) are marked with a thick outline.

