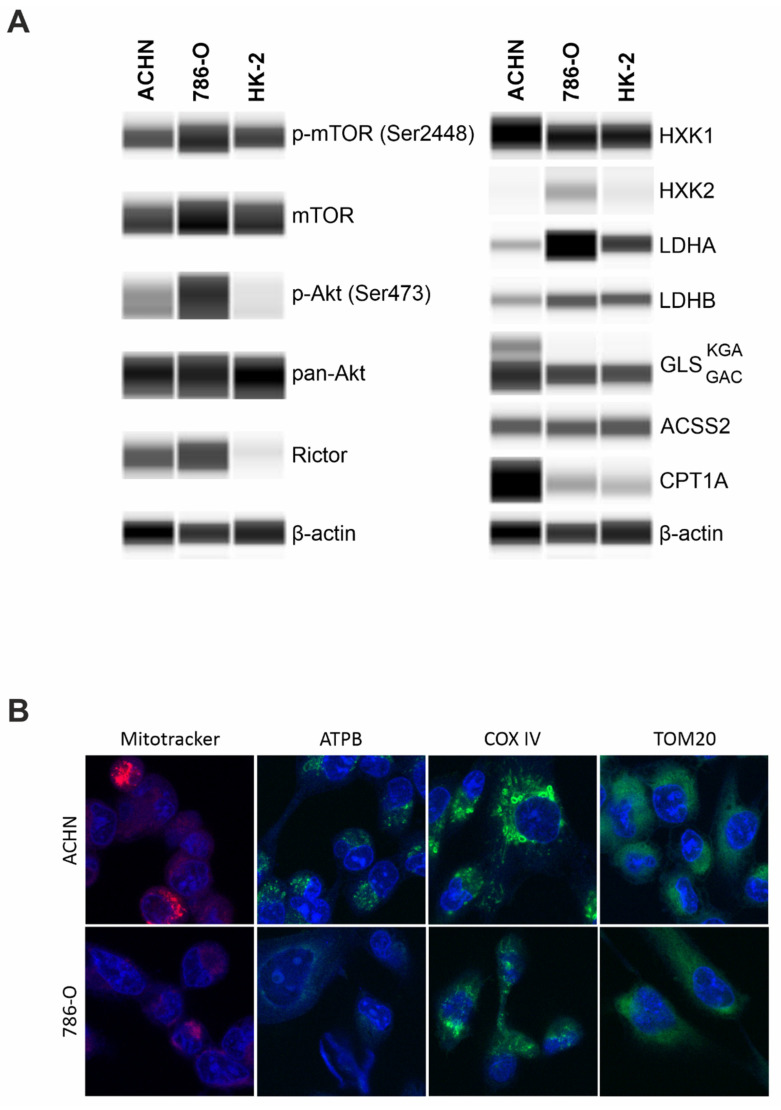
Figure 4.
WES analysis of mTOR activity, metabolic enzyme expressions, and in situ mitochondrial stainings of papillary (ACHN) and clear cell (786-O) renal cell carcinoma cell lines. (A) WES analysis of mTOR pathway and metabolic markers in papillary (ACHN), clear cell renal cell carcinoma (786-O), and normal tubular epithelial (HK-2) cell lines. β-actin was used as loading control. GLS levels were analyzed by a dual-specificity antibody showing both the KGA (60 kDa) and GAC (55 kDa) splice variants. Predicted protein sizes are provided in Table 2. (B) Higher staining intensity with Mitotracker, anti-ATPB, anti-COX IV in ACHN (PRCC) than 786-O (CCRCC) cell lines suggest pronounced mitochondrial OXPHOS function in PRCC cells; however, TOM20 stainings showed no differences (magnification 63×).

