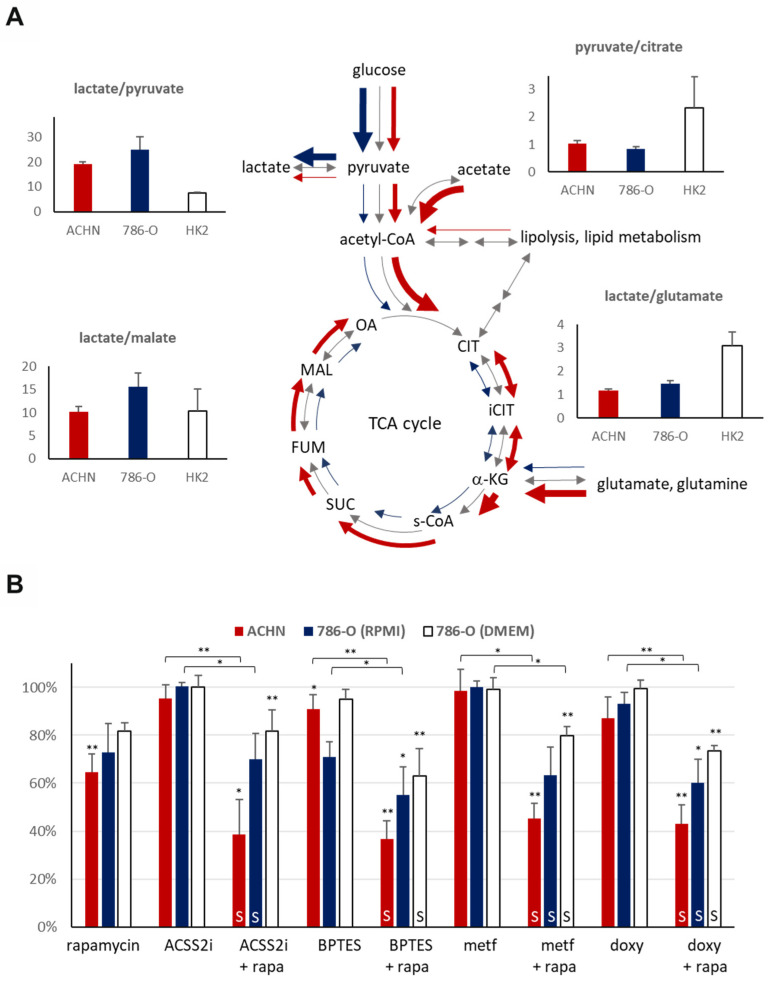
Figure 5.
LC–MS analyses of metabolic features and inhibitor sensitivity of papillary (ACHN) and clear cell renal cell carcinoma (786-O) cell lines. (A) LC–MS analysis of the intracellular metabolite concentrations in papillary (ACHN), clear cell (786-O) RCC and normal tubular epithelial (HK-2) cell lines. Lactate/pyruvate, pyruvate/citrate, and lactate/malate ratios were used to assess the glycolytic capacity and the activity of the TCA cycle of the cell lines (CIT–citrate, iCIT–isocitrate, α-KG–alpha-ketoglutarate, s-CoA–succinyl-CoA, SUC–succinate, FUM–fumarate, MAL–malate, OA–oxaloacetate), whereas lactate/glutamate ratio was used to evaluate the glutamine utilization. (B) The mTORC1 (rapamycin–rapa) and metabolic inhibitors (ACSS2i–inhibitor of acetate utilization, BPTES–glutaminolysis inhibitor, metformin–metf–AMPK-inhibitor, doxycycline–doxy–antibiotics with mitochondrial inhibitory effect) sensitivity of papillary (ACHN) and clear cell (786-O) RCC cell lines were evaluated as monotherapy or in combination. Regarding the 786-O cells, the treatments were performed both in RPMI-1640 (2000 mg/L glucose) medium under generally applied and optimized conditions and in DMEM high glucose (4500 mg/L)–to compare the role of maintaining parameters with similar glucose concentration levels as ACHN and HK-2 cells. * p values below 0.05, ** p values below 0.01 (one-way ANOVA with Tukey’s post hoc test), and at least 20% decrease in proliferation were considered biologically relevant. Synergistic treatment interactions were labeled with S (based on combination index calculation).

