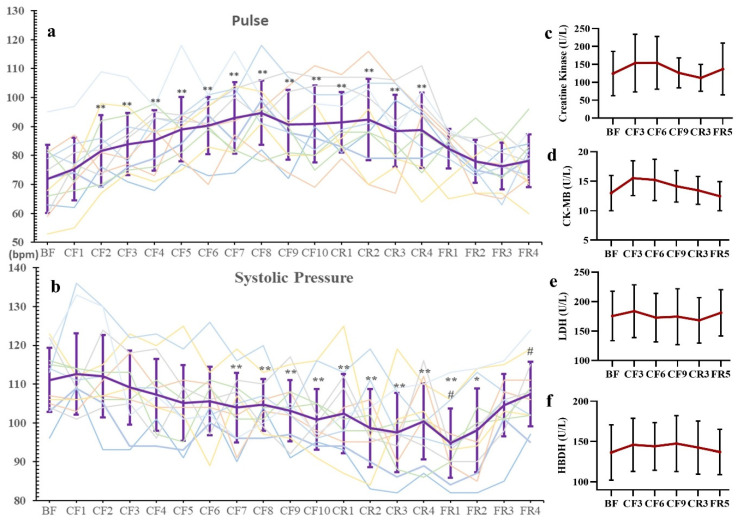
Figure 2.
The changes of pulse (a), systolic pressure (b) and Myocardial Enzymograms (c–f) during 10-day CF and refeeding period. Every line in a and b present its change of one participant. * p < 0.05, ** p < 0.01 vs. BF; # p < 0.05, vs. CF10, n = 13. BF: before fasting, CF: complete fasting, CR: calorie restriction, FR: full recovery; the number depicts days. CK: creatine kinase, LDH: lactate dehydrogenase, HBDH: α-hydroxybutyric dehydrogenase.

