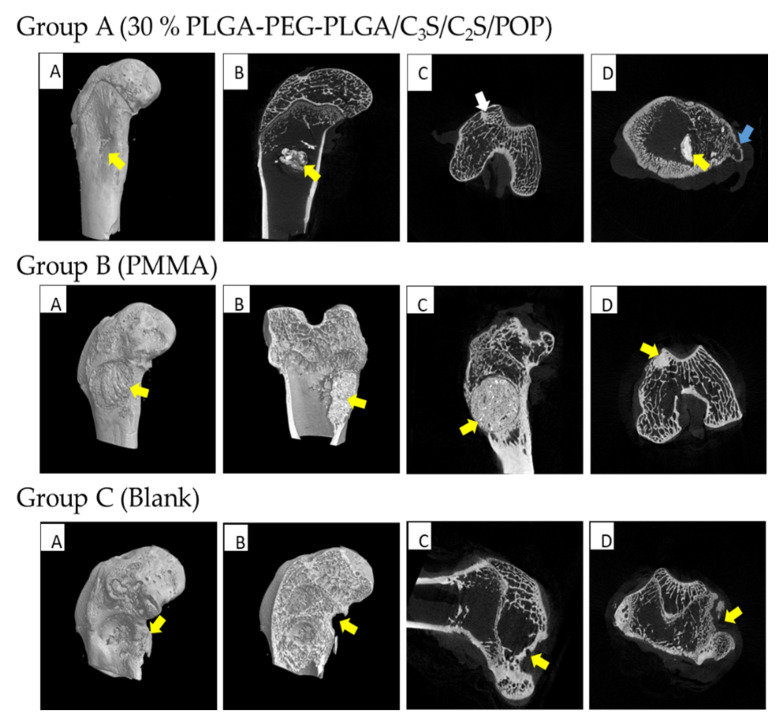
Figure 15.
MICRO-CT results of femoral condyles and implant material 12 weeks after operation. Group A (30% PLGA-PEG-PLGA/C3S/C2S/POP): (A) three-dimensional reconstruction, (B–D) sagittal, coronal, and horizontal planes, respectively. The yellow arrow pointed to the composite bone cement filler, and the filler was partially degraded, so the bone defect could be completely healed. The white arrow pointed to the new bone trabecula. The blue arrow indicates a nascent callus. Group B (PMMA): (A,B) reconstructed in three dimensions, and (C,D) sagittal and coronal, respectively. The location pointed by the yellow arrow was the filling material of PMMA bone cement. The filling material did not degrade, and the boundary with the surrounding bone substance was clear. Group C (Blank): (A,B) three-dimensional reconstruction map, (C) sagittal plane, and (D) coronal plane. The yellow arrow pointed to the defect of the femoral condyle, there was little generation of new bone trabeculae, and no complete healing was observed.

