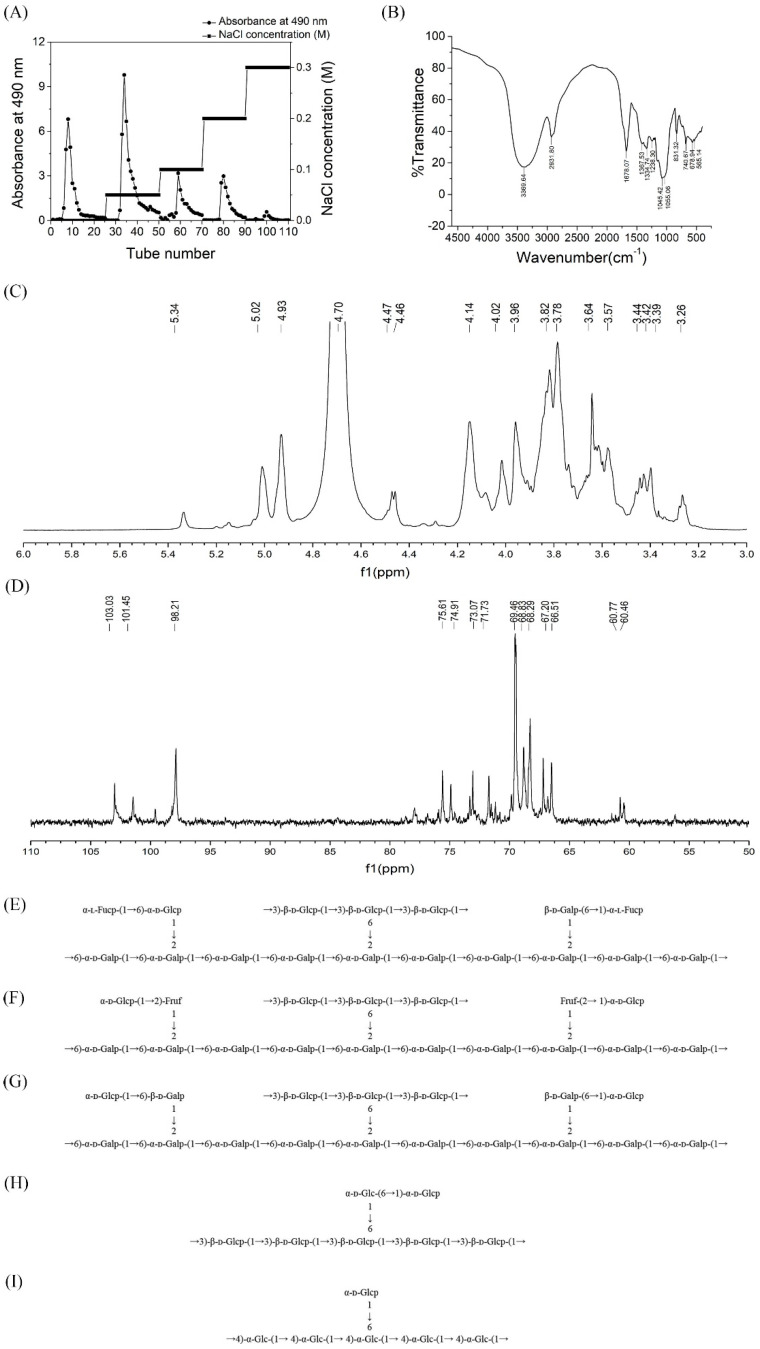
Figure 1.
Structural analysis of polysaccharides from Hericium erinaceus fruiting bodies. (A) Gradient elution curve of crude HEP on DEAE Cellulose-52 chromatography column. (B) FT-IR spectrum of HEP in the range of 4000–500 cm−1. (C) 1H-NMR and (D) 13C-NMR spectrum of HEP-1 isolated from Hericium erinaceus. Predicted structure of (E) HEP-1, (F) HEP-2, (G) HEP-3, (H) HEP-4 and (I) HEP-5 produced by the fungus Hericium erinaceus.

