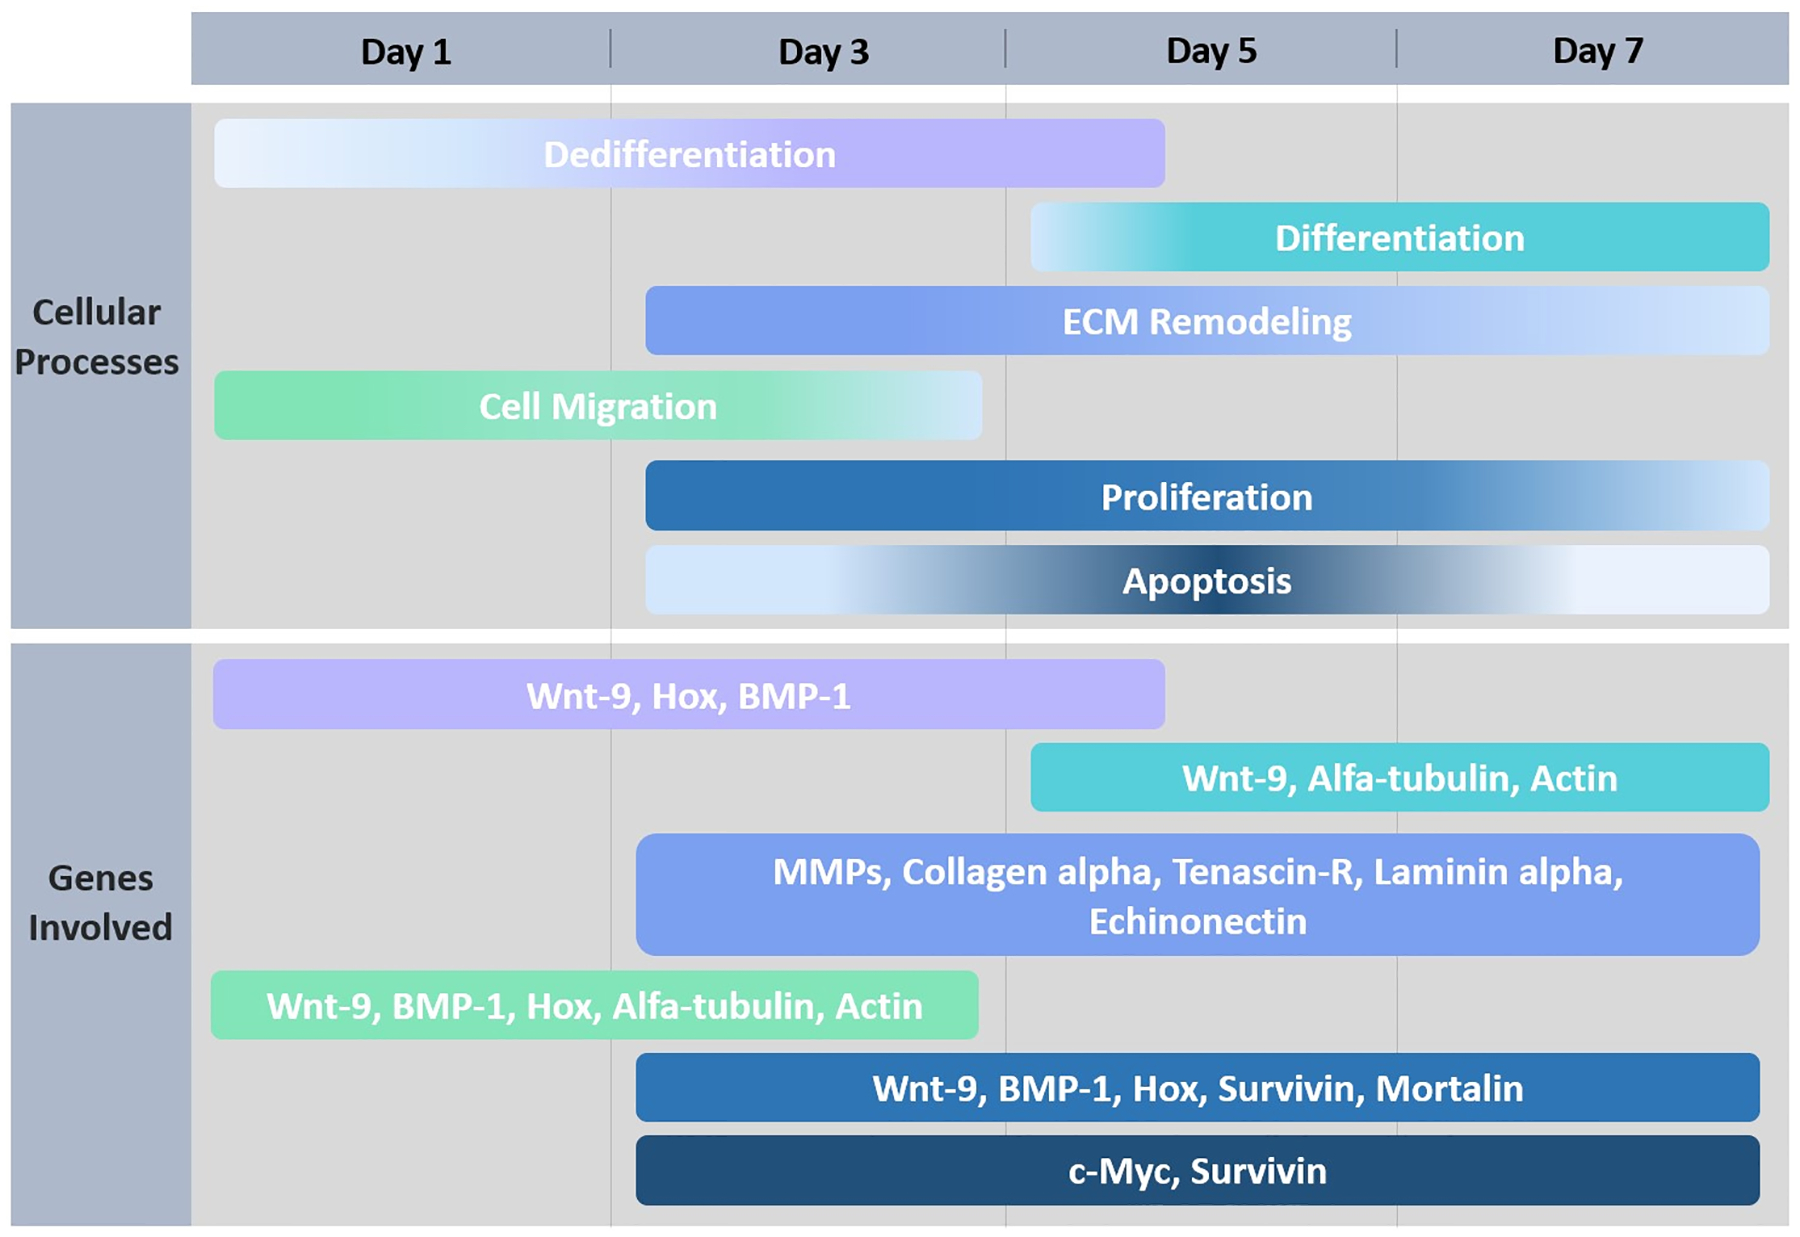
Fig 8. Schematic representation of cellular and molecular mechanisms during the first week of regeneration.

Timeline is represented by days of regeneration after de evisceration process occurs. Colors for each cellular process correspond to the same color for the genes that are associated with that process.
