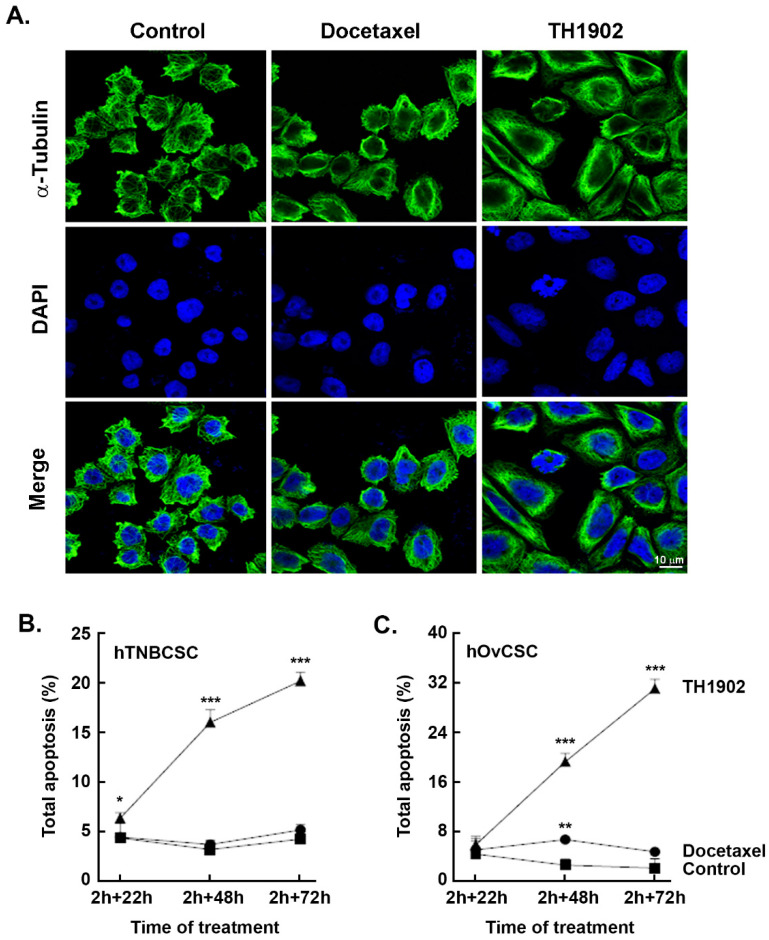
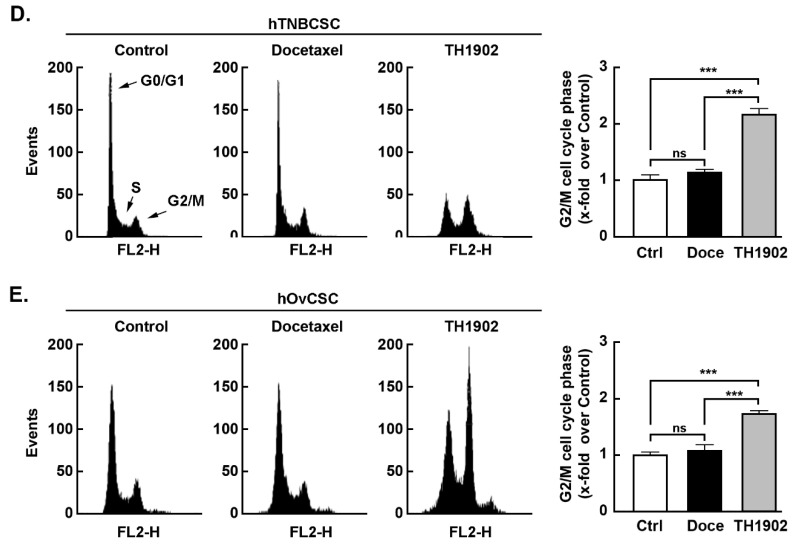
Figure 4.
TH1902 induces morphological changes, apoptosis, and cell cycle arrest in hTNBCSCand hOvCSC. Cells were treated in medium containing vehicle (DMSO, Control), 4 µM docetaxel or 2 μM TH1902 for 2 h and then incubated in complete medium for 22 to 72 h. (A) Treated hTNBCSC were fixed and immunostained with anti-α-tubulin Ab. Cells were then stained with DAPI before imaging by confocal microscopy. Representative pictures from each condition are displayed using fluorescence filters to demonstrate tubulin staining (green) and DAPI staining. The extent of apoptosis in (B) hTNBCSC or (C) hOvCSC was determined upon similar conditions as described above, and after different intervals of incubation ranging from 22 h to 72 h. Cells were harvested and then flow cytometry performed following staining with annexin V-FITC and propidium iodide (PI). Data were obtained from three different experiments and are represented as means +/− SEM; statistical analysis was performed for each time point using one-way ANOVA with Dunnett’s multiple comparison test (ns = non significant, * signifies p < 0.05, ** signifies p < 0.01 and *** signifies p < 0.001 for differences between TH1902 and control conditions). For cell cycling experiments, (D) hTNBCSC or (E) hOvCSC were treated for 2 h in medium containing vehicle (DMSO, Control), 4 µM Docetaxel or 2 μM TH1902, then incubated in complete fresh media for 22 h. The DNA content of each cell line after both intervals was analyzed by flow cytometry using FxCycle™ PI/RNase Staining Solution. The experiment was repeated 3–4 times and representative data are shown for hTNBCSC and for hOvCSC. Data are represented as means +/− SEM. Statistical analysis was performed using one-way ANOVA with Dunnett’s multiple comparison test (ns = non significant, *** signifies p < 0.001).


