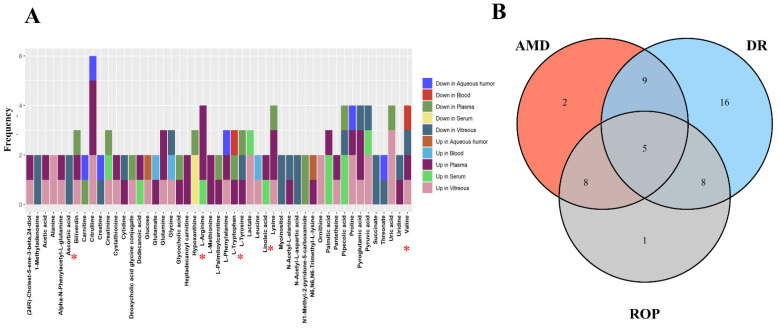
Figure 2.
(A) horizontal coordinates indicate the metabolites identified repeatedly in the study, vertical coordinates represent the frequency of repeated identification, colors represent the direction of metabolite variation across biological samples, and red asterisks mark the differential metabolites found in all three diseases. (B) represents the Venn diagram of the metabolites identified repeatedly in the different diseases. * Red asterisks indicate the five differential metabolites identified in three diseases.

