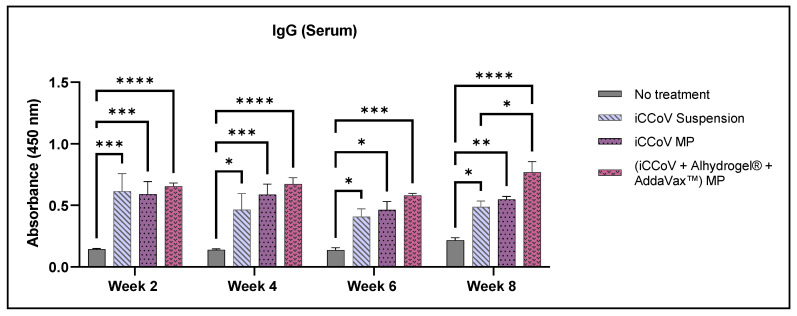
Figure 9.
Assessment of serum IgG antibody levels in mice. (Absorbance at 450 nm). Responses obtained are compared to the naïve group (No treatment control) and the iCCoV suspension group. Data are expressed as mean ± SEM, n = 4 mice, Two-way ANOVA, Post hoc Tukey’s multiple comparisons test. ns, non-significant, * p ≤ 0.05, ** p ≤ 0.01, *** p ≤ 0.001, **** p ≤ 0.0001.

