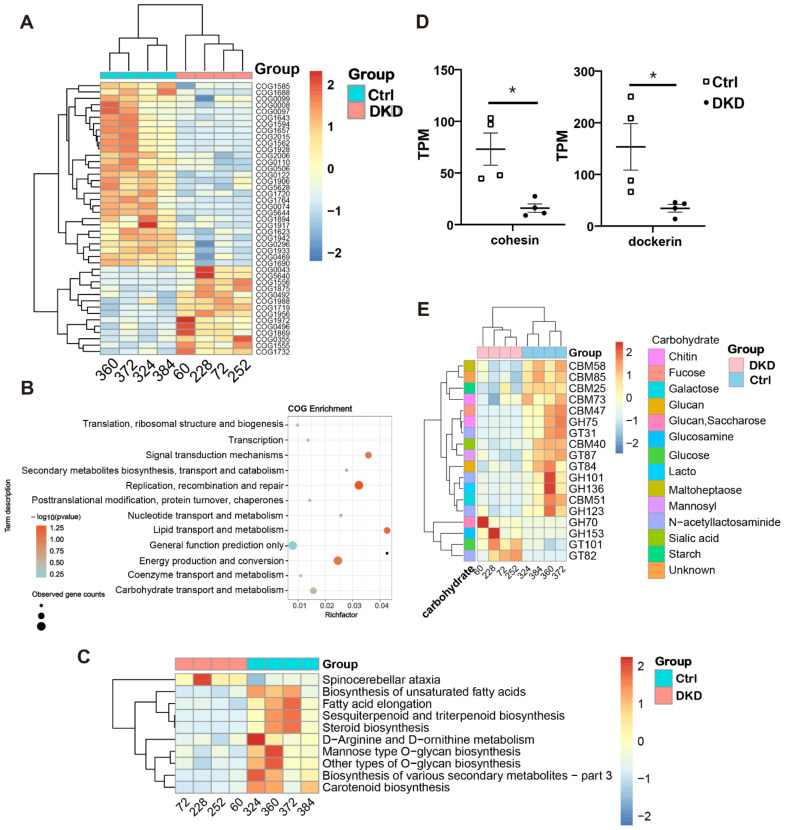
Figure 4.
The annotation results from COG, KEGG and CARD databases showed that the metabolic capacity of DKD microbiome changed. (A): The heat map shows the COG annotation results with significance; (B): COG pathway enrichment analysis bubble diagram was obtained using the ClusterProfile package in R; (C): The heat map displays the level 3 sequence annotation results from the KEGG database; (D): In CAZy annotation results, transcripts per million (TPM) values of cohesin and dockerin are shown at the class level; (E): CAZy annotation results at the family level show TPM values in the heat map (scaled by rows). * p < 0.05.

