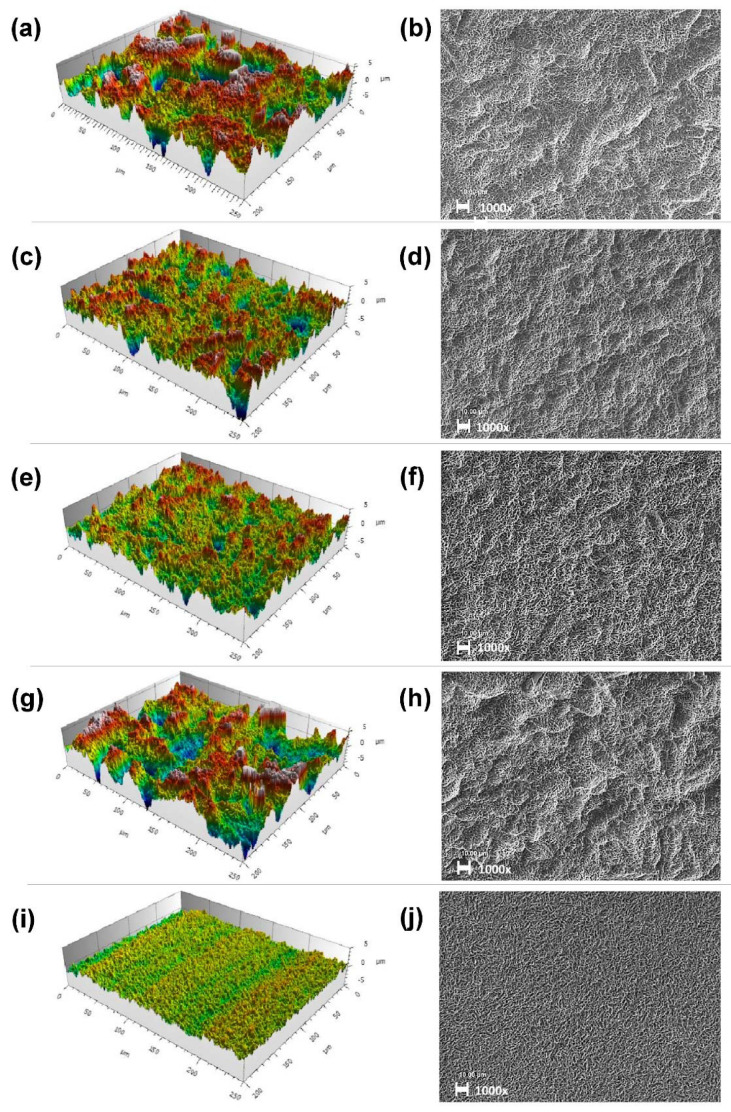
Figure 1.
Surface topography via CLSM (measuring field: 250 µm × 200 µm; Gaussian filter 50 × 50 µm) (a,c,e,g,i) and respective SEM pictures (b,d,f,h,j) of Ti6Al4V surfaces. Group 2.1: (a,b); group 2.2: (c,d); group 2.3: (e,f); group 2.4: (g,h); group 2.5: (i,j). SEM pictures were taken at 1000 times magnification. Scale bars represent 10 µm.

