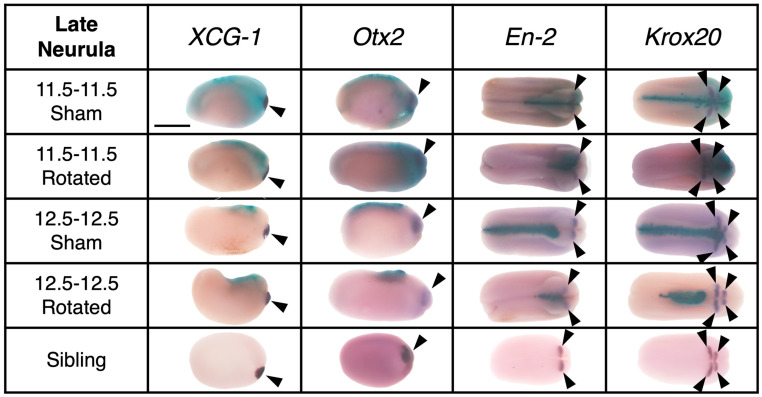
Figure 5.
Representative examples of expression of regional marker genes in transplants and sibling controls at late neurula stage (St. 18). With a lateral view with dorsal facing up for XCG-1 and Otx2, and dorsal view for En-2 and Krox20, anterior is to the right in all images. Purple stain marked with a solid arrowhead indicates gene expression and aqua blue stain was used to indicate transplant incorporation. Scale bar represents 1 mm.

