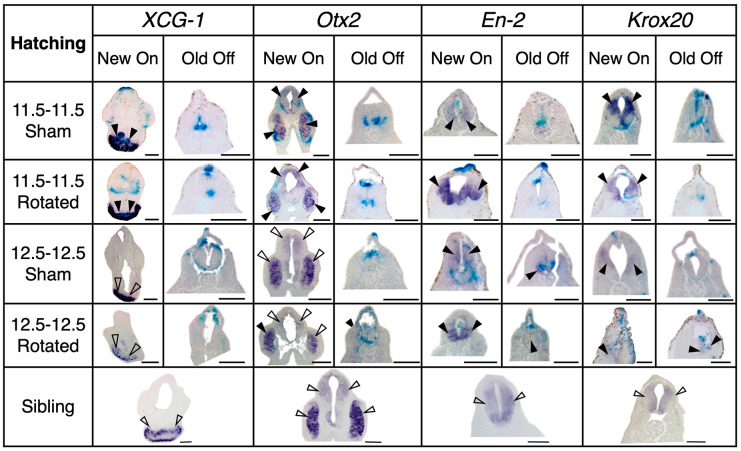
Figure 9.
Representative histology for transplants at hatching stage, with sibling control comparisons. Dorsal is facing up. Purple stain marked with a solid arrowhead indicates gene expression colocalized with transplant tissue, purple stain marked with an empty arrowhead indicates endogenous gene expression, and blue stain indicates transplant incorporation. Late gastrula rotated embryos show decreased levels of and more restricted area of marker gene expression at correct places compared with mid-gastrula sham and rotated embryos. Late gastrula rotated embryos also present more ectopic gene expression than mid-gastrula rotated embryos. Scale bar represents 250 µm.

