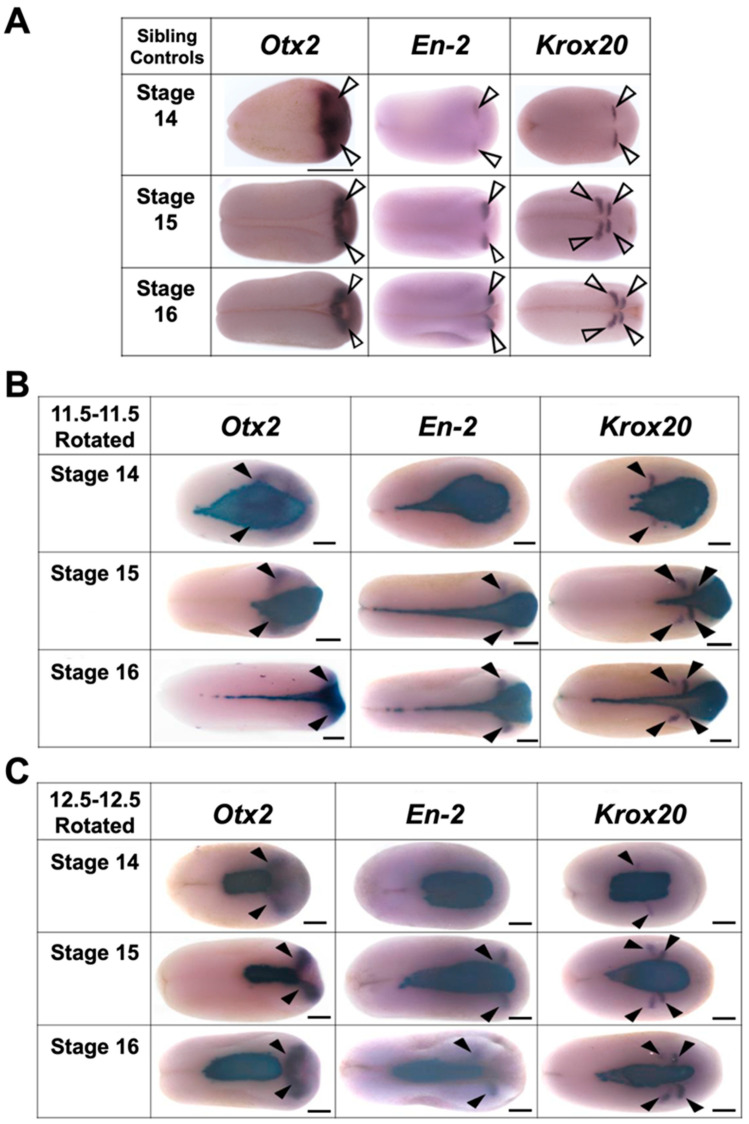
Figure 11.
Representative examples of expression of regional marker genes in (A) sibling control embryos, (B) mid-gastrula rotated transplants, and (C) late gastrula rotated embryos at stages 14 to 16. Dorsal view for all embryos, anterior is to the right. Purple stain marked with a solid arrowhead indicates gene expression and blue stain indicates transplant incorporation. Scale bar represents 250 µm.

