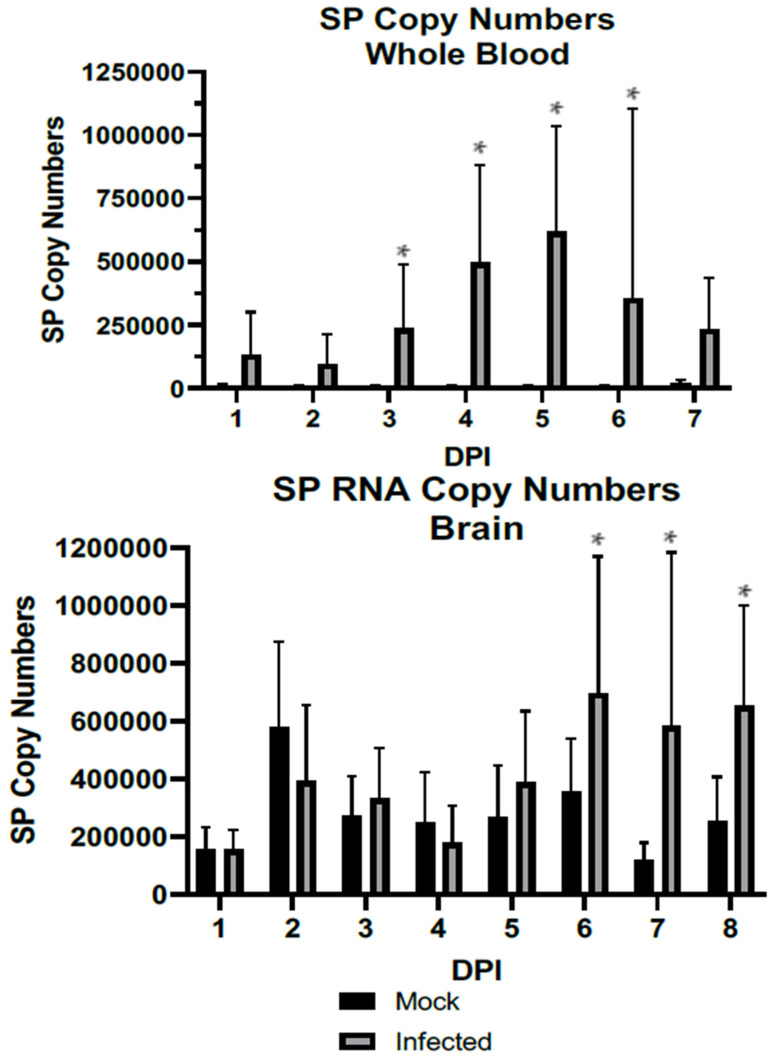
Figure 1.
RNA levels of SP as detected by qPCR against a standard curve in whole blood and brain. Top: Whole blood. Bottom: Whole brain tissue homogenate. Error bars represent the standard deviations. Significant differences between WNV-infected and mock mice were detected within 3 DPI (p = 0.0092) and remained significant at 4 DPI (p = 0.0007), 5 DPI (p = 0.0009), and 6 DPI (0.0012), while SP copy numbers’ increases in the brain are not detectable until 6 DPI (p = 0.0031). N = 10 per group per day, and N = 18 WNV-infected mice are included in the analyses of D6 and D7 due to early attrition. *: p < 0.01.

