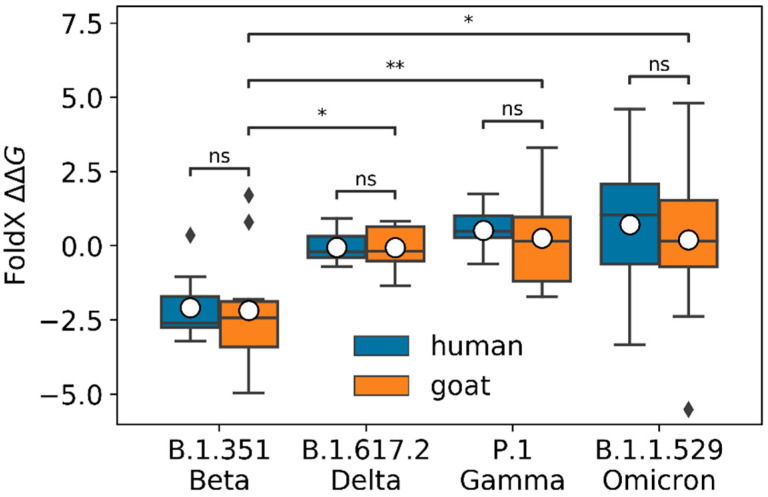
Figure 2.
FoldX predicted ∆∆G for B.1.351/Beta, B.1.617.2/Delta, P.1/Gamma, and B.1.1.529/Omicron variants for human and goat ACE2 (blue and orange boxes, respectively). For goat, the computed ∆∆G was significantly lower for the Beta variant than for the Delta, Gamma, and Omicron variants, with Mann–Whitney–Wilcoxon test p-values of , , and , respectively. The average ∆∆G predicted from the 10 Modeller models is plotted as a white dot for each variant. We found no significant differences between the predicted ∆∆G values for human and goat of the different variants (Mann–Whitney–Wilcoxon test p-values of for Delta, Beta, Gamma, and Omicron, respectively). In this boxplot representation, the lower and upper ends of each box represent the first (Q1) and third (Q3) quartiles of the ∆∆G predicted values, respectively. The horizontal line, inside each box, represents the median, or second quartile (Q2), and the mean is plotted as a white dot for each variant. The box “whiskers” extend to values that are 1.5 times the size of the interquartile range (IQR = Q3 − Q1). Values that fall outside this range are displayed independently as black diamonds. Mann-Whitney-Wilcoxon test p-values are annotated according to the following criteria: ns (0.05 < p-value ≤ 1), * (0.02 < p-value ≤ 0.05), ** (0.001 < p-value ≤ 0.02).

