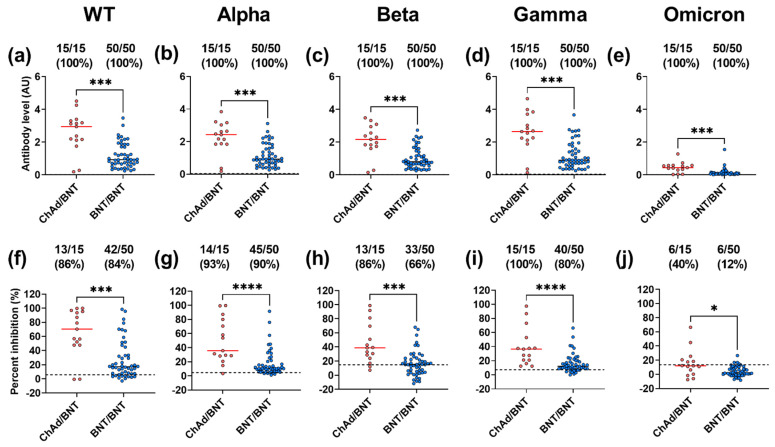
Figure 3.
IgG binding and ACE2 competition in vaccine groups to SARS-CoV-2 WT and the VoCs. Levels (AU, mean with SD) of IgG (a–e), and ACE2 competition (percent inhibition) (f–j) were measured between subjects in the ChAd/BNT group (red) and those in the BNT/BNT group (blue) against SARS-CoV-2 VoC WT, Alpha, Beta, Gamma, and Omicron. A Mann–Whitney test was performed between combinations of the two vaccine groups (* p = 0.05, *** p = 0.001, **** p = 0.0001). Positivity cut-offs are represented by a dashed black line. For each vaccine group, the number of positive individuals, total number of individuals tested, and percent reactivity is shown at the top of each panel.

