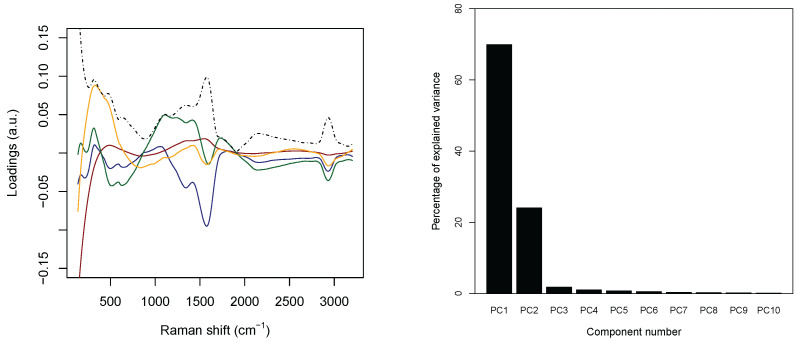
Figure 5.
(Left) the four solid lines report the loadings associated with the first four principal components (blue first, brown second, green third, and yellow fourth); the dashed black lines are the intensity, i.e., the square root of the sum of the squares, of the loadings of the first four components. (Right) percentage of variance as a function of the principal component index.

