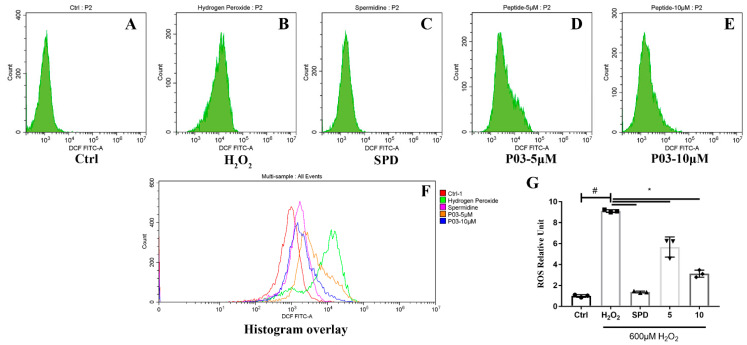
Figure 2.
The ROS levels of L02 cells. (A–E) The mean DCF fluorescence intensity of L02 cells in different groups with flow cytometry. (F) Histogram overlay of each group. (G) Quantitative analysis of ROS relative units in each group. Comparisons were made with one-way ANOVA. Values were expressed as the ratio of the control and represented as mean ± SD (n = 3) (compared to Ctrl, # p < 0.05; compared to H2O2, * p < 0.05) (n = 3).

