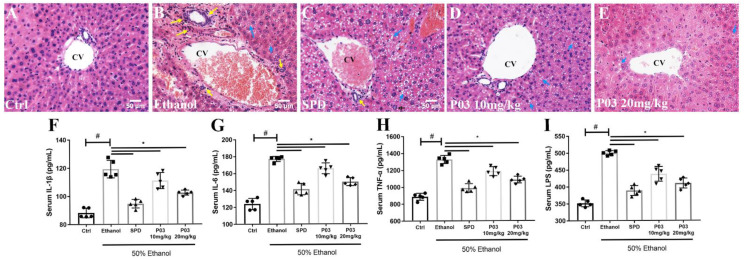
Figure 6.
Anti-inflammatory effects of P03 in mice with binge alcohol exposure. (A–E) Representative images of histological liver sections after H&E staining. Sections were visualized using Bioquant Osteo (20×). Yellow arrows represent neutrophil infiltration surrounding the central vein (CV); blue arrows represent microvesicular steatosis. Scale bar = 50 μM. (F–I) Serum levels of inflammatory cytokines and LPS in different groups. Comparisons were made with one-way ANOVA. Values are represented as mean ± SD. (Compared to Ctrl, # p < 0.05. Compared to ethanol, * p < 0.05) (n = 5).

