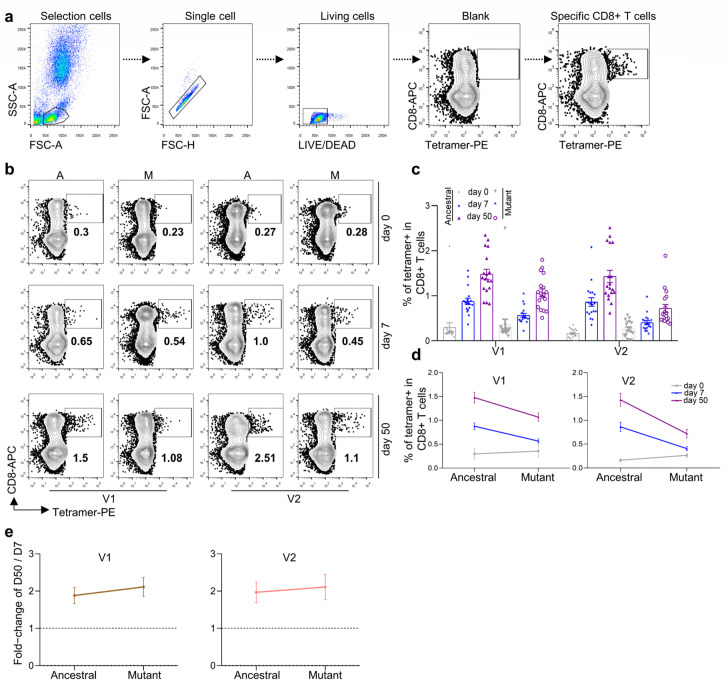
Figure 2.
Comparison and characterization of B.1.617.2 (Delta) and B.1.1.529 (Omicron) epitope-specific CD8 T cells between vaccine recipients at 7 and 50 days after the third vaccination dose. (a) Flow cytometry gating strategy for SARS-CoV-2 epitope-specific CD8 T cells. (b,c) Comparison of CD8 T cells specific to ancestral and mutant SARS-CoV-2 epitopes in HLA-A2+ healthy donors 0 (gray), 7 (blue), and 50 (purple) days after the third dose of inactivated SARS-CoV-2 vaccine. Specific CD8 T cells were individually stained with tetramers prepared using ancestral and mutant B.1.617.2 (Delta) and B.1.1.529 (Omicron) epitopes. (b) Representative plot of (c), n = 18 per group. A: ancestral; M: mutant. Variant strain IDs are the same as listed in Table 1. The flow cytometry gating strategy is shown in (a). (d) Overall statistics and comparison of CD8 T cells specific to B.1.617.2 (Delta, left) and B.1.1.529 (Omicron, right) epitopes in HLA-A2+ healthy donors 0 (gray), 7 (blue), and 50 (purple) days after the third dose of inactivated SARS-CoV-2 vaccine. Data shown are the mean ± standard error of the mean (SEM), n = 18 per group. (e) Summary statistics of detection fold-change of CD8 T cells specific to B.1.617.2 (Delta, left) and B.1.1.529 (Omicron, right) epitopes between 50 and 7 days after the third dose. Data shown are the mean ± SD.

