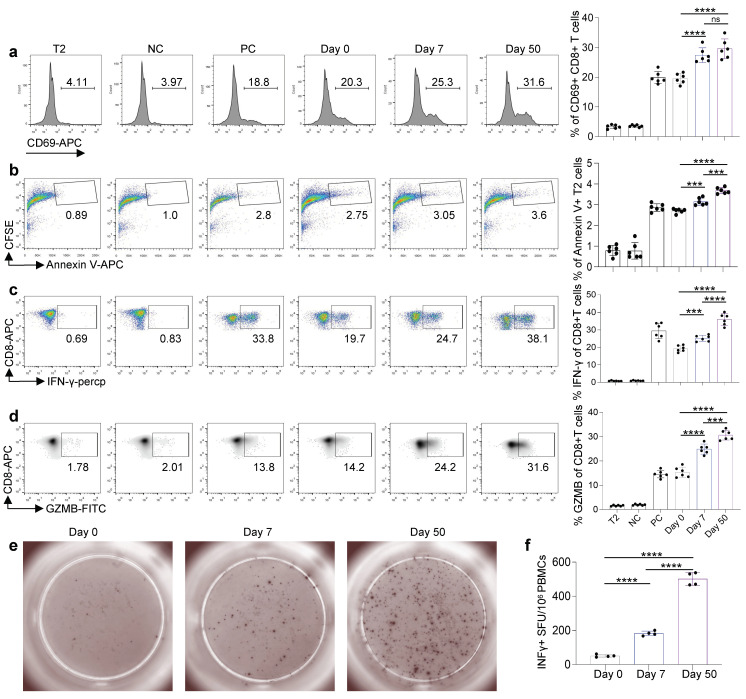
Figure 4.
Comparison and characterization of the cytotoxic effects of SARS-CoV-2 epitopes in recipients. (a–d) Characterization of epitope-specific CD8 T cells after vaccination. CD8 T cells isolated from vaccinated donors after the third dose (days 7 and 50) were cocultivated with T2 cells loaded with SARS-CoV-2 epitopes at a 1:1 ratio and analyzed for the expression of CD69 after 16 h (a). The proportion of CFSE+ Annexin V+ T2 cells presenting distinct SARS-CoV-2 antigens after 7 days of culturing with CD8 T cells (b). Expression of IFN-γ (c) and Granzyme B (d) by CD8 T cells after epitope stimulation for 7 days. Day 0: control before stimulation; Day 7: 7 days after the third dose; Day 50: 50 days after the third dose. T2: T2 control cells without any peptide; NC: negative control, T2 cells loaded with EBV virus peptide IVTDFSVIK; PC: positive control, T2 cells loaded with influenza A M1 peptide GILGFVFTL. Data are summarized as the mean ± SD. n = 6 for each group. Statistical significance was determined by one-tailed t test or one-way ANOVA. (e,f) Exemplary microscopy image (e) and summary statistics (f) for the anti-IFN-γ ELISpot assay on PBMC cells from vaccinated donors (0, 7, and 50 days after the third dose) stimulated by the 9 SARS-CoV-2 ancestral epitopes (mixed; as shown in Table 1). ****: p < 0.0001, ***: p < 0.001.

