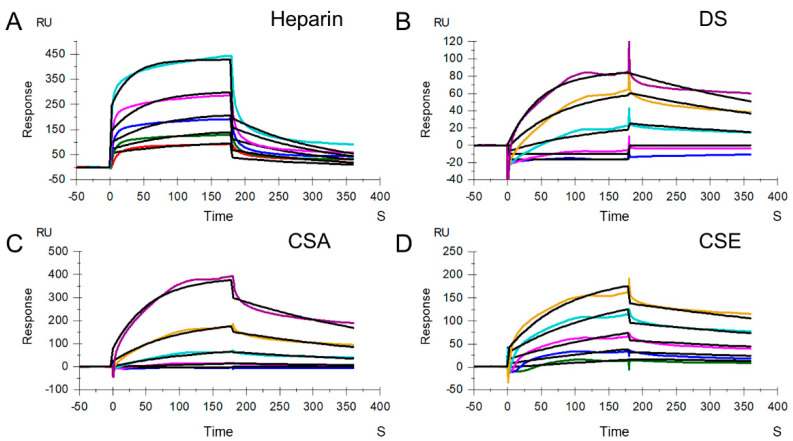
Figure 3.
SPR sensorgrams of MPXV A29 binding with GAGs. (A) SPR sensorgrams of MPXV A29 binding with heparin. Concentrations of MPXV A29 (from top to bottom) are 1000, 500, 250, 125, and 63 nM, respectively. (B) SPR sensorgrams of MPXV A29 binding with DS. Concentrations of MPXV A29 (from top to bottom) are 4000, 2000, 1000, 500, and 250 nM, respectively. (C) SPR sensorgrams of MPXV A29 binding with CSA. Concentrations of MPXV A29 (from top to bottom) are 4000, 2000, 1000, 500, and 250 nM, respectively. (D) SPR sensorgrams of MPXV A29 binding with CSE. Concentrations of MPXV A29 (from top to bottom) are 2000, 1000, 500, 250, and 125 nM, respectively. The black curves are the fits using models from T200 Evaluate software 3.2.

