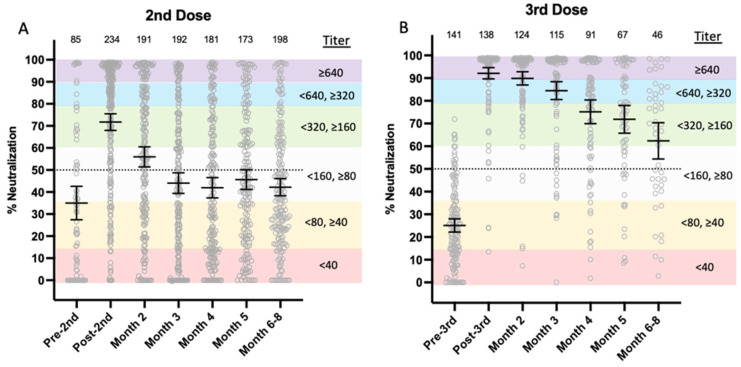
Figure 2.
Overall comparison of second- and third-dose COVID-19 mRNA vaccine-induced NAb durability. (A) Second dose; (B) third dose. Gray circles represent percent neutralization from each study participant vaccinated with either BNT162b2 or mRNA-1273 within one week prior to vaccination (Pre-2nd), 2–4 weeks postvaccination (Post-2nd), then monthly after either second or third doses. The horizontal black lines with error bars represent mean with 95% confidence intervals. Dotted line is 50% neutralization. Numbers above each x-axis time point indicate the number of participants. Reciprocal titer ranges corresponding to % neutralization are shown on the graphs as shaded purple (≥1:640), blue (<1:640, ≥1:320), green (<1:320, >1:160), light grey (<1:160, ≥1:80), orange (<1:80, ≥1:40), and red (<1:40) as reported in [18]. Percent neutralization was calculated as 1-(test line density/limit of detection) x100% (limit of detection test line density = 942,481), as detailed previously [18].

