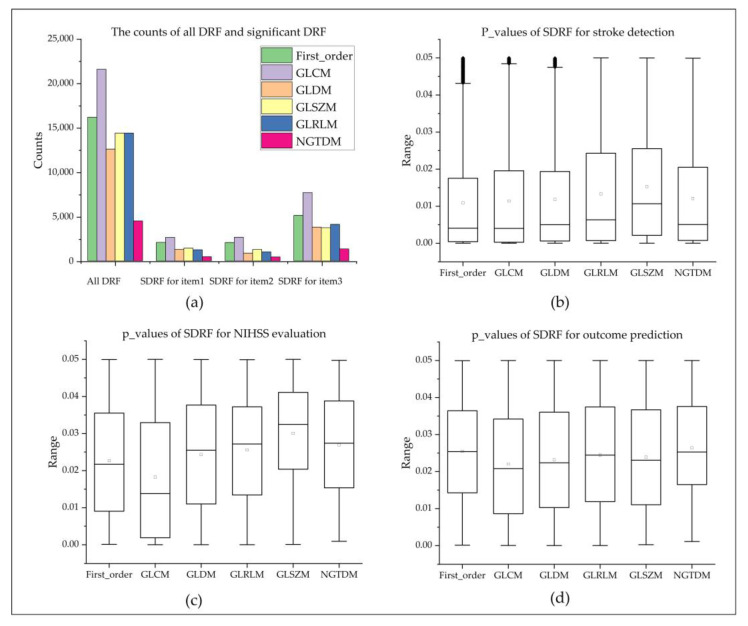
Figure 3.
Statistics of all DRF and box plots of DRF for three evaluation items. (a) shows the distribution of DRF; (b–d) are the box plots of the p-values of significant DRF in each feature group for stroke detection, NIHSS evaluation, and outcome prediction, wherein item 1, item 2, and item 3 are stroke detection, NIHSS evaluation, and outcome prediction, respectively.

