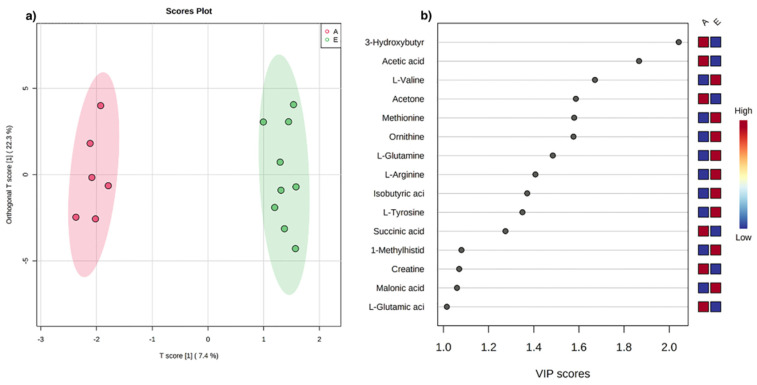
Figure 1.
(a) O-PLS-DA score plot for 1H NMR data collected in 1D-NOESY spectra acquired at 600 MHz. Data represent the sera from 9 early (green) and 6 advanced (red) ALS patients. (b) VIP score analysis derived from O-PLS-DA. Color code indicates higher (red) or lower (blue) concentrations in early (E) compared to advanced (A) ALS patients.

