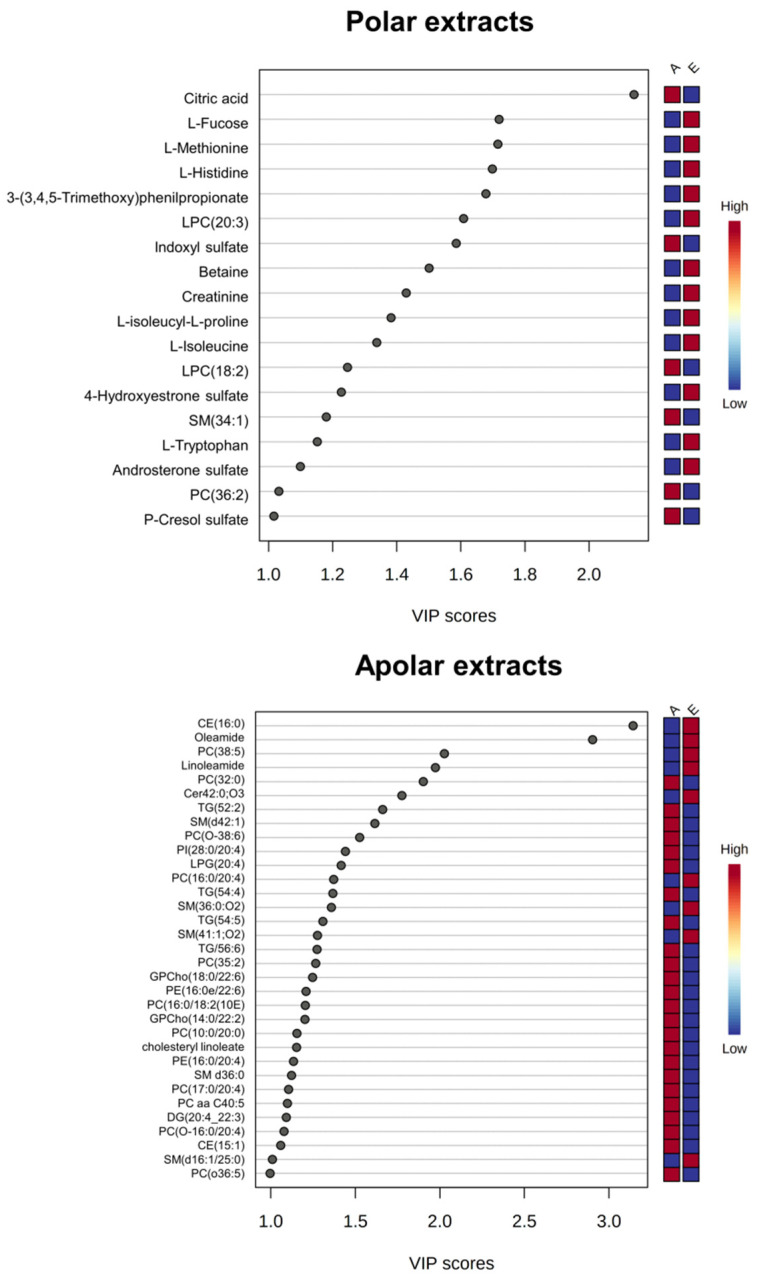
Figure 3.
O-PLS-DA VIP graphs for the HRMS data collected using ESI (+) and (−). Data are relative to polar (top) and apolar (bottom) serum extracts of early compared to advanced ALS patients. The color code indicates higher (red) or lower (blue) concentrations in early (E) compared to advanced (A) ALS patients.

